Blogs, insights, guides and videos on India's unlisted market — all in one place.

<div id="snippet" class="style-scope ytd-text-inline-expander"><span id="snippet-text" class="style-scope ytd-text-inline-expander"><span id="plain-snippet-text" class="style-scope ytd-text-inline-expander">NSE ke H1 FY26 results aaye aur market ko mile mixed signals, revenue 15% aur profit 12% down! SEBI ke F&O rules ne derivative volumes ko kaafi slow kar diya hai. Phir bhi, NSE ki market share 90%+ pe solid bani hui hai. Kya recovery 2–4 quarters mein possible hai?</span></span></div> <div id="source-attributions-wrapper" class="style-scope ytd-expandable-video-description-body-renderer"></div>

<p data-start="75" data-end="397">In the world of lending, growth and prudence rarely walk hand in hand. Yet, SK Finance Limited seems determined to prove otherwise. The Jaipur-based NBFC, known for its strong presence in vehicle and MSME lending, has clocked an impressive first half in FY 2026 — a period marked by both opportunity and margin pressure.</p> <h3><strong>Financial Performance H1 FY26 Vs H1 FY25</strong></h3> <h3 data-start="404" data-end="434"> </h3> <h3 data-start="404" data-end="434"><strong data-start="408" data-end="434"><img src="https://unlistedzone.com/storage/knowledge-logo/app_image-1763008779.jpg" alt="" width="715" height="708" />Riding the Credit Boom</strong></h3> <p data-start="435" data-end="776">SK Finance’s loan book has ballooned <strong data-start="472" data-end="483">49% YoY</strong>, touching ₹ 16,029 crore. This isn’t a one-off spurt. The company has built its strength where others hesitate — <strong data-start="597" data-end="627">semi-urban and rural India</strong>.<br data-start="628" data-end="631" />Its bread and butter?<br data-start="652" data-end="655" />Used-vehicle financing and MSME loans — segments still underserved by traditional banks but booming with credit demand.</p> <p data-start="778" data-end="922">Such rapid expansion shows how deep-rooted distribution and localized underwriting can deliver growth even in tightening liquidity conditions.</p> <hr data-start="924" data-end="927" /> <h3 data-start="929" data-end="965"><strong data-start="933" data-end="965">Topline Up, Margins Squeezed</strong></h3> <p data-start="966" data-end="1241">Revenue from operations jumped <strong data-start="997" data-end="1010">19.6% YoY</strong> to ₹ 1,349 crore, thanks to higher disbursements.<br data-start="1060" data-end="1063" />But here’s the flip side — finance costs rose <strong data-start="1109" data-end="1116">21%</strong>, eating into spreads.<br data-start="1138" data-end="1141" />Net Interest Income grew <strong data-start="1166" data-end="1173">13%</strong>, but the <strong data-start="1183" data-end="1238">Net Interest Margin fell sharply from 10.5% to 7.9%</strong>.</p> <p data-start="1243" data-end="1430">Higher borrowing costs, a competitive lending environment, and limited ability to hike lending rates have all conspired to compress margins — a theme playing out across the NBFC sector.</p> <hr data-start="1432" data-end="1435" /> <h3 data-start="1437" data-end="1478"><strong data-start="1441" data-end="1478">Still Managing to Deliver Profits</strong></h3> <p data-start="1479" data-end="1797">Despite cost pressure, SK Finance’s <strong data-start="1515" data-end="1535">Profit After Tax</strong> grew <strong data-start="1541" data-end="1552">21% YoY</strong> to ₹ 179 crore.<br data-start="1568" data-end="1571" />How?<br data-start="1575" data-end="1578" />Operational discipline.<br data-start="1601" data-end="1604" />The company’s cost control, digitisation of collections, and strong recovery mechanism cushioned the hit.<br data-start="1709" data-end="1712" />The <strong data-start="1716" data-end="1748">ROE slipped slightly to 9.8%</strong>, but profitability in absolute terms improved.</p> <p data-start="1799" data-end="1886">In other words — even if margins are thinning, the pie itself has gotten much bigger.</p> <hr data-start="1888" data-end="1891" /> <h3 data-start="1893" data-end="1935"><strong data-start="1897" data-end="1935">Asset Quality: Stable Under Stress</strong></h3> <p data-start="1936" data-end="2300">Rapid growth often hides bad loans — but not here.<br data-start="1986" data-end="1989" /><strong data-start="1989" data-end="1997">GNPA</strong> stands at <strong data-start="2008" data-end="2017">4.77%</strong> (almost flat YoY) and <strong data-start="2040" data-end="2048">NNPA</strong> at <strong data-start="2052" data-end="2061">3.27%</strong>.<br data-start="2062" data-end="2065" />For an NBFC expanding its loan book by nearly 50%, that stability is noteworthy.<br data-start="2145" data-end="2148" />Collateral-backed lending and early delinquency tracking have helped, though asset quality remains higher than that of larger, more diversified peers.</p> <hr data-start="2302" data-end="2305" /> <h3 data-start="2307" data-end="2349"><strong data-start="2311" data-end="2349">Returns — Moderate, Yet Consistent</strong></h3> <p data-start="2350" data-end="2527">ROA of <strong data-start="2357" data-end="2365">2.2%</strong> and ROE near <strong data-start="2379" data-end="2386">10%</strong> position SK Finance among well-managed mid-tier NBFCs.<br data-start="2441" data-end="2444" />As its asset base compounds, margins may stabilise and lift these ratios further.</p> <p data-start="2529" data-end="2742">But investors should note — growth can’t indefinitely outrun cost of funds. Future profitability hinges on lowering borrowing costs through <strong data-start="2669" data-end="2739">securitisation, co-lending, and institutional debt diversification</strong>.</p> <hr data-start="2744" data-end="2747" /> <h3 data-start="2749" data-end="2773"><strong data-start="2753" data-end="2773">Challenges Ahead</strong></h3> <ul data-start="2774" data-end="3044"> <li data-start="2774" data-end="2863"> <p data-start="2776" data-end="2863"><strong data-start="2776" data-end="2801">Rising Cost of Funds:</strong> The biggest headwind; rate hikes continue to pressure NIMs.</p> </li> <li data-start="2864" data-end="2941"> <p data-start="2866" data-end="2941"><strong data-start="2866" data-end="2892">Competitive Intensity:</strong> NBFCs and fintechs are crowding rural lending.</p> </li> <li data-start="2942" data-end="3044"> <p data-start="2944" data-end="3044"><strong data-start="2944" data-end="2968">Regulatory Scrutiny:</strong> RBI’s tighter norms on provisioning and leverage could weigh on earnings.</p> </li> </ul> <hr data-start="3046" data-end="3049" /> <h3 data-start="3051" data-end="3080"><strong data-start="3055" data-end="3080">Opportunity Landscape</strong></h3> <ul data-start="3081" data-end="3355"> <li data-start="3081" data-end="3168"> <p data-start="3083" data-end="3168"><strong data-start="3083" data-end="3116">Tier-III & Tier-IV Expansion:</strong> Credit penetration in smaller towns is still low.</p> </li> <li data-start="3169" data-end="3261"> <p data-start="3171" data-end="3261"><strong data-start="3171" data-end="3196">Digital Underwriting:</strong> AI-driven scoring and predictive recovery models can cut NPAs.</p> </li> <li data-start="3262" data-end="3355"> <p data-start="3264" data-end="3355"><strong data-start="3264" data-end="3281">MSME Lending:</strong> SK’s regional presence positions it perfectly for cluster-based growth.</p> </li> </ul> <hr data-start="3357" data-end="3360" /> <h3 data-start="3362" data-end="3409"><strong data-start="3366" data-end="3409">UnlistedZone View — Growth with Caution</strong></h3> <p data-start="3410" data-end="3677">SK Finance’s H1 FY 2026 report is a mix of <strong data-start="3453" data-end="3494">strong momentum and prudent execution</strong>.<br data-start="3495" data-end="3498" />It’s expanding faster than peers, keeping credit quality in check, and digitising its backbone.<br data-start="3593" data-end="3596" />However, margin compression due to high borrowing costs is a near-term concern.</p> <p data-start="3679" data-end="3909">For investors in the <strong data-start="3700" data-end="3718">unlisted space</strong>, SK Finance remains a <strong data-start="3741" data-end="3777">structurally strong growth story</strong> — but not a risk-free one. Sustained discipline in underwriting and liability management will be key to long-term value creation.</p> <hr data-start="3911" data-end="3914" /> <p data-start="3916" data-end="4118" data-is-last-node="" data-is-only-node=""><strong data-start="3916" data-end="3932">Bottom Line:</strong><br data-start="3932" data-end="3935" />SK Finance is doing what every NBFC dreams of — growing aggressively without losing control.<br data-start="4027" data-end="4030" />If it can keep that balance, it’s not just scaling a loan book — it’s compounding trust.</p>

<p>Ramaraju Cotton Mills Limited, a part of the Ramco Group, operates in textiles, surgical products, and renewable energy through windmills. The company’s H1 FY2026 results show a significant operational turnaround, marked by improved margins, strong cash flows, and better cost efficiency despite continued losses at the bottom line. Below is a comprehensive breakdown of performance across segments and financial parameters.</p> <h3><strong>1. Revenue Performance</strong></h3> <p><strong><img src="https://unlistedzone.com/storage/knowledge-logo/app_image-1762932071.jpg" alt="" width="776" height="481" /></strong></p> <p><strong>Detailed Analysis:</strong></p> <ul data-spread="false"> <li> <p><strong>Topline Growth:</strong> The company’s total income from operations grew <strong>16% YoY</strong>, from ₹174 crore in H1 FY2025 to ₹202 crore in H1 FY2026. The increase is primarily driven by higher realizations and demand recovery in the <strong>textile segment</strong>, which contributes about 89% of total revenue.</p> </li> <li> <p><strong>Textile Segment:</strong> Revenue rose by 20% YoY, reflecting higher export orders and stable yarn demand. Better product mix and pricing helped margins.</p> </li> <li> <p><strong>Surgical Segment:</strong> Marginal dip in surgical revenue (₹26 crore vs ₹27 crore) indicates stagnation in this division. However, it remains a stable contributor with consistent margins.</p> </li> <li> <p><strong>Wind Energy Segment:</strong> Revenue improved slightly to ₹8 crore from ₹7 crore last year, aided by improved power generation efficiency.</p> </li> </ul> <h2><strong>2. Profitability Analysis</strong></h2> <p><strong><img src="https://unlistedzone.com/storage/knowledge-logo/app_image-1762932110.jpg" alt="" width="726" height="507" /></strong></p> <p><strong>Detailed Analysis:</strong></p> <ul data-spread="false"> <li> <p><strong>EBITDA Improvement:</strong> The company achieved a massive improvement in EBITDA, increasing more than <strong>8x YoY</strong> to ₹33 crore. This surge reflects strict cost discipline, optimized raw material procurement, and better realization in the textile segment.</p> </li> <li> <p><strong>Margin Expansion:</strong> EBITDA margins jumped to <strong>16.3%</strong> from <strong>2.3%</strong> a year earlier, signaling a turnaround in core operations.</p> </li> <li> <p><strong>Net Losses:</strong> Despite better operating results, the company recorded a <strong>net loss of ₹25 crore</strong>, mainly due to high interest expenses and depreciation. However, the loss margin narrowed slightly compared to H1 FY2025.</p> </li> <li> <p><strong>Cost Structure:</strong> Raw material cost to sales ratio declined, showing improved efficiency. Power costs from in-house windmills also provided cost savings.</p> </li> </ul> <h3><strong>3. Balance Sheet Position</strong></h3> <p><strong><img src="https://unlistedzone.com/storage/knowledge-logo/app_image-1762932150.jpg" alt="" width="697" height="432" /></strong></p> <p><strong>Detailed Analysis:</strong></p> <ul data-spread="false"> <li> <p><strong>Asset Base:</strong> Fixed assets declined marginally, indicating limited capital expenditure. The company continues to operate efficiently with its existing manufacturing base.</p> </li> <li> <p><strong>Debt and Leverage:</strong> Debt levels remain high at ₹423 crore. With equity down to ₹211 crore, the <strong>debt-to-equity ratio is around 2.0x</strong>, indicating financial leverage pressure.</p> </li> <li> <p><strong>Working Capital:</strong> Inventory levels have stabilized at ₹121 crore, suggesting better inventory management and supply chain control.</p> </li> <li> <p><strong>Equity Decline:</strong> The fall in equity reflects cumulative losses, but improved operations can help gradual recovery.</p> </li> </ul> <h3><strong>4. Cash Flow Analysis</strong></h3> <p><strong><img src="https://unlistedzone.com/storage/knowledge-logo/app_image-1762932198.jpg" alt="" width="710" height="440" /></strong></p> <p><strong>Detailed Analysis:</strong></p> <ul data-spread="false"> <li> <p><strong>Operational Cash Flow Surge:</strong> CFO rose sharply to ₹34 crore, reflecting better operating efficiency, strong working capital control, and improved collection cycles.</p> </li> <li> <p><strong>Investing Activity:</strong> Minimal capital investment in H1 FY2026 indicates cautious capex strategy amid recovery.</p> </li> <li> <p><strong>Financing Activity:</strong> Outflow of ₹29 crore primarily relates to repayment of borrowings and interest payments.</p> </li> <li> <p><strong>Liquidity Position:</strong> Closing cash balance improved to ₹7 crore, compared to ₹1 crore at the end of FY2025 — signaling improved liquidity.</p> </li> </ul> <h3><strong>5. Segment Outlook and Future Prospects</strong></h3> <ul data-spread="false"> <li> <p><strong>Textile Division:</strong> Expected to benefit from steady demand in both domestic and export markets, though global cotton price volatility may impact short-term profitability.</p> </li> <li> <p><strong>Surgical Segment:</strong> Stable, low-risk business expected to maintain consistent contribution. Potential to expand margins through higher value-added products.</p> </li> <li> <p><strong>Windmill Operations:</strong> Renewable energy continues to support the company’s cost structure by reducing dependence on external power sources.</p> </li> </ul> <h3><strong>6. Key Ratios and Highlights</strong></h3> <ul data-spread="false"> <li> <p><strong>EBITDA Margin:</strong> 16.3% (vs 2.3% YoY)</p> </li> <li> <p><strong>PAT Margin:</strong> -12.4% (vs -12.6% YoY)</p> </li> <li> <p><strong>Debt-to-Equity Ratio:</strong> ~2.0x</p> </li> <li> <p><strong>Operating Cash Flow Growth:</strong> 750% YoY</p> </li> <li> <p><strong>Revenue Growth:</strong> 16% YoY</p> </li> </ul> <h3><strong>7. Investment Perspective for UnlistedZone Readers</strong></h3> <ul data-spread="false"> <li> <p><strong>Operational Recovery in Progress:</strong> The company’s sharp margin improvement and strong CFO indicate a turnaround at the operational level.</p> </li> <li> <p><strong>Leverage Concerns Remain:</strong> High debt and interest costs continue to affect net profitability. Debt reduction remains a key focus area.</p> </li> <li> <p><strong>Improving Efficiency:</strong> Better cost control, stable inventory, and improved power efficiency through windmills enhance competitiveness.</p> </li> <li> <p><strong>Positive Liquidity Trend:</strong> Rising cash reserves and strong CFO improve short-term financial stability.</p> </li> </ul> <h3><strong>Conclusion</strong></h3> <p>Ramaraju Cotton Mills has demonstrated a strong operating turnaround in H1 FY2026, with significant improvement in margins and cash flows. Although profitability remains negative due to financial leverage, the company’s fundamentals have strengthened. If margin momentum sustains and debt reduction follows, Ramaraju could enter a phase of consistent profitability in the coming quarters.</p> <p>For investors in the <strong>unlisted market</strong>, this performance highlights an improving business trajectory. Continued focus on efficiency, deleveraging, and export recovery will be the key drivers for long-term value creation.</p> <p> </p> <h3>Disclaimer</h3> <p>UnlistedZone is not a SEBI-registered Research Analyst or Investment Advisor. All information provided on our platform is strictly for educational and informational purposes. We do not offer investment advice or stock recommendations. Investors are advised to conduct their own due diligence or consult a SEBI-registered advisor. Investments in unlisted and pre-IPO shares are subject to market risks including illiquidity and volatility. UnlistedZone does not assure any returns or accept liability for investment outcomes based on this report.</p> <p> </p>

<h2><strong>The Background</strong></h2> <p>In September 2023, Apollo Fashion International Limited was incorporated. In June 2024, it acquired the fashion division from Apollo Green Energy Limited through a Business Transfer Agreement (BTA). The company manufactures footwear, leather garments, and accessories for fashion brands.</p> <p>Let’s walk through what the annual report tells us.</p> <hr /> <h2><strong>Part 1: The Business Transfer Agreement</strong></h2> <h3><strong>The Transaction Structure</strong></h3> <p>On July 9, 2024, Apollo Fashion signed a Business Transfer Agreement with Apollo Green Energy Limited, with an effective date of June 1, 2024.</p> <p><strong>Assets Acquired:</strong></p> <ul> <li>Property, plant and equipment: ₹23.54 crores</li> <li>Intangible assets under development: ₹6.31 crores</li> <li>Inventories: ₹52.33 crores</li> <li>Trade receivables: ₹49.19 crores</li> <li>Cash and bank balances: ₹1.30 crores</li> <li>Other assets: ₹6.93 crores</li> <li><strong>Total assets:</strong> ₹139.6 crores (approximately)</li> </ul> <p><strong>Liabilities Assumed:</strong></p> <ul> <li>Vehicle loans: ₹1.0 crores</li> <li>Employee benefit obligations: ₹1.47 crores</li> <li>Short-term borrowings: ₹28.76 crores</li> <li>Trade payables: ₹30.32 crores</li> <li>Other liabilities: ₹16.28 crores (approximately)</li> <li><strong>Total liabilities:</strong> ₹76.96 crores</li> </ul> <p><strong>Net Assets Acquired:</strong> ₹62.66 crores</p> <p><strong>Consideration Paid:</strong></p> <ul> <li>Cash: ₹61.50 crores</li> <li>Equity shares (1,11,67,200 shares at ₹30 each): ₹33.50 crores</li> <li><strong>Total consideration:</strong> ₹95.00 crores</li> </ul> <p><strong>Capital Reserve:</strong> The difference between net assets (₹62.66 crores) and consideration paid (₹95.00 crores) resulted in a capital reserve of ₹32.34 crores (negative).</p> <h3><strong>The Accounting Treatment</strong></h3> <p>The annual report notes that this is a common control business combination under Ind AS 103. Therefore, all business transactions relating to the fashion division are included in Apollo Fashion’s financials from September 6, 2023 (incorporation date), even though the legal transfer happened on June 1, 2024.</p> <p>However, for tax and other legal purposes, transactions from September 6, 2023 to June 1, 2024 remain in Apollo Green Energy’s books.</p> <hr /> <h2><strong>Part 2: Financial Performance</strong></h2> <h3><strong>The Reporting Period Caveat</strong></h3> <p><strong>FY 2023-24</strong> covers September 6, 2023 to March 31, 2024—<strong>only 7 months</strong>, not a full year. This makes year-on-year comparisons tricky.</p> <p>For FY 2022-23, the annual report provides P&L data when the fashion division was still part of Apollo Green Energy.</p> <h3><strong>Profit & Loss Statement</strong></h3> <table style="width: 55.4969%; height: 348.333px;"> <thead> <tr style="height: 36.6667px;"> <th style="text-align: center; width: 43.4104%; height: 36.6667px;"><strong>Particulars</strong></th> <th style="text-align: center; width: 18.0766%; height: 36.6667px;"><strong>FY 2022-23</strong></th> <th style="text-align: center; width: 18.0766%; height: 36.6667px;"><strong>FY 2023-24</strong></th> <th style="text-align: center; width: 18.0766%; height: 36.6667px;"><strong>FY 2024-25</strong></th> </tr> </thead> <tbody> <tr style="height: 18.3333px;"> <td style="text-align: center; width: 43.4104%; height: 18.3333px;"> </td> <td style="text-align: center; width: 18.0766%; height: 18.3333px;">(Full year)</td> <td style="text-align: center; width: 18.0766%; height: 18.3333px;">(7 months)</td> <td style="text-align: center; width: 18.0766%; height: 18.3333px;">(Full year)</td> </tr> <tr style="height: 18.3333px;"> <td style="text-align: center; width: 43.4104%; height: 18.3333px;"><strong>Revenue from Operations</strong></td> <td style="text-align: center; width: 18.0766%; height: 18.3333px;">₹208 Cr</td> <td style="text-align: center; width: 18.0766%; height: 18.3333px;">₹89.98 Cr</td> <td style="text-align: center; width: 18.0766%; height: 18.3333px;">₹182.44 Cr</td> </tr> <tr style="height: 18.3333px;"> <td style="text-align: center; width: 43.4104%; height: 18.3333px;">Cost of Material Consumed</td> <td style="text-align: center; width: 18.0766%; height: 18.3333px;">₹153 Cr</td> <td style="text-align: center; width: 18.0766%; height: 18.3333px;">₹60.76 Cr</td> <td style="text-align: center; width: 18.0766%; height: 18.3333px;"> ₹136 Cr</td> </tr> <tr style="height: 18.3333px;"> <td style="text-align: center; width: 43.4104%; height: 18.3333px;">Change in Inventory</td> <td style="text-align: center; width: 18.0766%; height: 18.3333px;">(₹1.78 Cr)</td> <td style="text-align: center; width: 18.0766%; height: 18.3333px;">(₹1.38 Cr)</td> <td style="text-align: center; width: 18.0766%; height: 18.3333px;">(₹0.29 Cr)</td> </tr> <tr style="height: 18.3333px;"> <td style="text-align: center; width: 43.4104%; height: 18.3333px;"><strong>Gross Margins</strong></td> <td style="text-align: center; width: 18.0766%; height: 18.3333px;">27.10%</td> <td style="text-align: center; width: 18.0766%; height: 18.3333px;">34%</td> <td style="text-align: center; width: 18.0766%; height: 18.3333px;">~25.25%</td> </tr> <tr style="height: 18.3333px;"> <td style="text-align: center; width: 43.4104%; height: 18.3333px;">Employee Benefit Expenses</td> <td style="text-align: center; width: 18.0766%; height: 18.3333px;">₹20.58 Cr</td> <td style="text-align: center; width: 18.0766%; height: 18.3333px;">₹5.85 Cr</td> <td style="text-align: center; width: 18.0766%; height: 18.3333px;">₹14.83 Cr</td> </tr> <tr style="height: 18.3333px;"> <td style="text-align: center; width: 43.4104%; height: 18.3333px;">Other Expenses</td> <td style="text-align: center; width: 18.0766%; height: 18.3333px;">₹3.60 Cr</td> <td style="text-align: center; width: 18.0766%; height: 18.3333px;">₹6.89 Cr</td> <td style="text-align: center; width: 18.0766%; height: 18.3333px;">₹9.29 Cr</td> </tr> <tr style="height: 18.3333px;"> <td style="text-align: center; width: 43.4104%; height: 18.3333px;"><strong>EBITDA</strong></td> <td style="text-align: center; width: 18.0766%; height: 18.3333px;">₹22.30 Cr</td> <td style="text-align: center; width: 18.0766%; height: 18.3333px;">₹17.86 Cr</td> <td style="text-align: center; width: 18.0766%; height: 18.3333px;">₹21.95 Cr</td> </tr> <tr style="height: 18.3333px;"> <td style="text-align: center; width: 43.4104%; height: 18.3333px;"><strong>OPM (EBITDA margin)</strong></td> <td style="text-align: center; width: 18.0766%; height: 18.3333px;">10.70%</td> <td style="text-align: center; width: 18.0766%; height: 18.3333px;">19.85%</td> <td style="text-align: center; width: 18.0766%; height: 18.3333px;">12.03%</td> </tr> <tr style="height: 18.3333px;"> <td style="text-align: center; width: 43.4104%; height: 18.3333px;">Other Income</td> <td style="text-align: center; width: 18.0766%; height: 18.3333px;">₹0.39Cr</td> <td style="text-align: center; width: 18.0766%; height: 18.3333px;">₹0.31 Cr</td> <td style="text-align: center; width: 18.0766%; height: 18.3333px;">₹3.51 Cr</td> </tr> <tr style="height: 18.3333px;"> <td style="text-align: center; width: 43.4104%; height: 18.3333px;">Finance Cost</td> <td style="text-align: center; width: 18.0766%; height: 18.3333px;">₹3.70 Cr</td> <td style="text-align: center; width: 18.0766%; height: 18.3333px;">₹3.70 Cr</td> <td style="text-align: center; width: 18.0766%; height: 18.3333px;">₹5.08 Cr</td> </tr> <tr style="height: 18.3333px;"> <td style="text-align: center; width: 43.4104%; height: 18.3333px;">Depreciation & Amortization</td> <td style="text-align: center; width: 18.0766%; height: 18.3333px;">₹2.09 Cr</td> <td style="text-align: center; width: 18.0766%; height: 18.3333px;">₹2.09 Cr</td> <td style="text-align: center; width: 18.0766%; height: 18.3333px;">₹2.90 Cr</td> </tr> <tr style="height: 18.3333px;"> <td style="text-align: center; width: 43.4104%; height: 18.3333px;"><strong>EBIT</strong></td> <td style="text-align: center; width: 18.0766%; height: 18.3333px;">₹20.21 Cr</td> <td style="text-align: center; width: 18.0766%; height: 18.3333px;">₹15.05 Cr</td> <td style="text-align: center; width: 18.0766%; height: 18.3333px;">₹19.05 Cr</td> </tr> <tr style="height: 18.3333px;"> <td style="text-align: center; width: 43.4104%; height: 18.3333px;"><strong>PBT</strong></td> <td style="text-align: center; width: 18.0766%; height: 18.3333px;">₹16.88 Cr</td> <td style="text-align: center; width: 18.0766%; height: 18.3333px;">₹16.25 Cr</td> <td style="text-align: center; width: 18.0766%; height: 18.3333px;">₹17.47 Cr</td> </tr> <tr style="height: 18.3333px;"> <td style="text-align: center; width: 43.4104%; height: 18.3333px;">Tax Expense</td> <td style="text-align: center; width: 18.0766%; height: 18.3333px;">₹0</td> <td style="text-align: center; width: 18.0766%; height: 18.3333px;">₹4.10</td> <td style="text-align: center; width: 18.0766%; height: 18.3333px;">₹4.40 Cr</td> </tr> <tr style="height: 18.3333px;"> <td style="text-align: center; width: 43.4104%; height: 18.3333px;"><strong>PAT</strong></td> <td style="text-align: center; width: 18.0766%; height: 18.3333px;">₹16.88 Cr</td> <td style="text-align: center; width: 18.0766%; height: 18.3333px;">₹12.15 Cr</td> <td style="text-align: center; width: 18.0766%; height: 18.3333px;">₹13.07 Cr</td> </tr> <tr style="height: 18.3333px;"> <td style="text-align: center; width: 43.4104%; height: 18.3333px;"><strong>NPM (Net margin)</strong></td> <td style="text-align: center; width: 18.0766%; height: 18.3333px;">8.1%</td> <td style="text-align: center; width: 18.0766%; height: 18.3333px;">13.50%</td> <td style="text-align: center; width: 18.0766%; height: 18.3333px;">7.16%</td> </tr> </tbody> </table> <p><strong>Note:</strong> FY23-24 EBITDA margin of 19.85% is based on 7-month actuals. The annualized equivalent would be different.</p> <h3><strong>Key Financial Metrics</strong></h3> <p><strong>For FY 2024-25:</strong></p> <ul> <li>Revenue grew from ₹89.98 Cr (7 months in FY24) to ₹182.44 Cr (full year in FY25)</li> <li>EBITDA increased from ₹17.86 Cr to ₹21.95 Cr</li> <li>Net profit increased from ₹12.15 Cr to ₹13.07 Cr</li> </ul> <hr /> <h2><strong>Part 3: Balance Sheet</strong></h2> <h3><strong>Assets (as of March 31, 2025)</strong></h3> <table> <thead> <tr> <th style="text-align: center;"><strong>Particulars</strong></th> <th style="text-align: center;"><strong>March 31, 2024</strong></th> <th style="text-align: center;"><strong>March 31, 2025</strong></th> </tr> </thead> <tbody> <tr> <td style="text-align: center;"><strong>Non-Current Assets</strong></td> <td style="text-align: center;"> </td> <td style="text-align: center;"> </td> </tr> <tr> <td style="text-align: center;">Property, Plant & Equipment</td> <td style="text-align: center;">₹21.71 Cr</td> <td style="text-align: center;">₹23.50 Cr</td> </tr> <tr> <td style="text-align: center;">Right of Use Assets</td> <td style="text-align: center;">₹3.46 Cr</td> <td style="text-align: center;">₹2.68 Cr</td> </tr> <tr> <td style="text-align: center;">Intangible Assets</td> <td style="text-align: center;">₹0.21 Cr</td> <td style="text-align: center;">₹0.42 Cr</td> </tr> <tr> <td style="text-align: center;">Other Financial Assets</td> <td style="text-align: center;">₹0.56 Cr</td> <td style="text-align: center;">₹0.64 Cr</td> </tr> <tr> <td style="text-align: center;"><strong>Total Non-Current</strong></td> <td style="text-align: center;"><strong>₹25.94 Cr</strong></td> <td style="text-align: center;"><strong>₹27.24 Cr</strong></td> </tr> <tr> <td style="text-align: center;"><strong>Current Assets</strong></td> <td style="text-align: center;"> </td> <td style="text-align: center;"> </td> </tr> <tr> <td style="text-align: center;">Inventories</td> <td style="text-align: center;">₹52.55 Cr</td> <td style="text-align: center;">₹48.58 Cr</td> </tr> <tr> <td style="text-align: center;">Trade Receivables</td> <td style="text-align: center;">₹21.71 Cr</td> <td style="text-align: center;">₹46.75 Cr</td> </tr> <tr> <td style="text-align: center;">Cash & Cash Equivalents</td> <td style="text-align: center;">₹5.08 Cr</td> <td style="text-align: center;">₹0.04 Cr</td> </tr> <tr> <td style="text-align: center;">Other Bank Balances</td> <td style="text-align: center;">₹0.32 Cr</td> <td style="text-align: center;">₹12.00 Cr</td> </tr> <tr> <td style="text-align: center;">Other Financial Assets</td> <td style="text-align: center;">₹1.58 Cr</td> <td style="text-align: center;">₹7.48 Cr</td> </tr> <tr> <td style="text-align: center;">Other Current Assets</td> <td style="text-align: center;">₹5.76 Cr</td> <td style="text-align: center;">₹7.10 Cr</td> </tr> <tr> <td style="text-align: center;"><strong>Total Current</strong></td> <td style="text-align: center;"><strong>₹87.00 Cr</strong></td> <td style="text-align: center;"><strong>₹121.96 Cr</strong></td> </tr> <tr> <td style="text-align: center;"><strong>TOTAL ASSETS</strong></td> <td style="text-align: center;"><strong>₹112.94 Cr</strong></td> <td style="text-align: center;"><strong>₹149.20 Cr</strong></td> </tr> </tbody> </table> <h3><strong>Equity & Liabilities (as of March 31, 2025)</strong></h3> <table> <thead> <tr> <th style="text-align: center;"><strong>Particulars</strong></th> <th style="text-align: center;"><strong>March 31, 2024</strong></th> <th style="text-align: center;"><strong>March 31, 2025</strong></th> </tr> </thead> <tbody> <tr> <td style="text-align: center;"><strong>Equity</strong></td> <td style="text-align: center;"> </td> <td style="text-align: center;"> </td> </tr> <tr> <td style="text-align: center;">Equity Share Capital</td> <td style="text-align: center;">₹14.47 Cr</td> <td style="text-align: center;">₹29.77 Cr</td> </tr> <tr> <td style="text-align: center;">Other Equity</td> <td style="text-align: center;">₹13.38 Cr</td> <td style="text-align: center;">₹19.81 Cr</td> </tr> <tr> <td style="text-align: center;"><strong>Total Equity</strong></td> <td style="text-align: center;"><strong>₹27.86 Cr</strong></td> <td style="text-align: center;"><strong>₹49.57 Cr</strong></td> </tr> <tr> <td style="text-align: center;"><strong>Non-Current Liabilities</strong></td> <td style="text-align: center;"> </td> <td style="text-align: center;"> </td> </tr> <tr> <td style="text-align: center;">Borrowings</td> <td style="text-align: center;">₹0.06 Cr</td> <td style="text-align: center;">₹2.16 Cr</td> </tr> <tr> <td style="text-align: center;">Lease Liabilities</td> <td style="text-align: center;">₹2.62 Cr</td> <td style="text-align: center;">₹2.25 Cr</td> </tr> <tr> <td style="text-align: center;">Provisions</td> <td style="text-align: center;">₹1.12 Cr</td> <td style="text-align: center;">₹1.36 Cr</td> </tr> <tr> <td style="text-align: center;">Deferred Tax Liabilities</td> <td style="text-align: center;">₹0.16 Cr</td> <td style="text-align: center;">₹0.40 Cr</td> </tr> <tr> <td style="text-align: center;"><strong>Total Non-Current</strong></td> <td style="text-align: center;"><strong>₹3.95 Cr</strong></td> <td style="text-align: center;"><strong>₹6.17 Cr</strong></td> </tr> <tr> <td style="text-align: center;"><strong>Current Liabilities</strong></td> <td style="text-align: center;"> </td> <td style="text-align: center;"> </td> </tr> <tr> <td style="text-align: center;">Borrowings</td> <td style="text-align: center;">₹14.90 Cr</td> <td style="text-align: center;">₹63.66 Cr</td> </tr> <tr> <td style="text-align: center;">Lease Liabilities</td> <td style="text-align: center;">₹0.91 Cr</td> <td style="text-align: center;">₹0.69 Cr</td> </tr> <tr> <td style="text-align: center;">Trade Payables (MSME)</td> <td style="text-align: center;">₹2.38 Cr</td> <td style="text-align: center;">₹3.72 Cr</td> </tr> <tr> <td style="text-align: center;">Trade Payables (Others)</td> <td style="text-align: center;">₹5.82 Cr</td> <td style="text-align: center;">₹20.19 Cr</td> </tr> <tr> <td style="text-align: center;">Other Financial Liabilities</td> <td style="text-align: center;">₹51.81 Cr</td> <td style="text-align: center;">₹1.35 Cr</td> </tr> <tr> <td style="text-align: center;">Other Current Liabilities</td> <td style="text-align: center;">₹0.67 Cr</td> <td style="text-align: center;">₹1.68 Cr</td> </tr> <tr> <td style="text-align: center;">Provisions</td> <td style="text-align: center;">₹0.67 Cr</td> <td style="text-align: center;">₹0.68 Cr</td> </tr> <tr> <td style="text-align: center;">Current Tax Liabilities</td> <td style="text-align: center;">₹3.97 Cr</td> <td style="text-align: center;">₹1.48 Cr</td> </tr> <tr> <td style="text-align: center;"><strong>Total Current</strong></td> <td style="text-align: center;"><strong>₹81.12 Cr</strong></td> <td style="text-align: center;"><strong>₹93.46 Cr</strong></td> </tr> <tr> <td style="text-align: center;"><strong>TOTAL LIABILITIES</strong></td> <td style="text-align: center;"><strong>₹85.08 Cr</strong></td> <td style="text-align: center;"><strong>₹99.63 Cr</strong></td> </tr> </tbody> </table> <h3><strong>Key Balance Sheet Observations</strong></h3> <p><strong>Working Capital Items:</strong></p> <ul> <li>Trade receivables increased 115% from ₹21.71 Cr to ₹46.75 Cr</li> <li>Inventories decreased 8% from ₹52.55 Cr to ₹48.58 Cr</li> <li>Cash declined 99% from ₹5.08 Cr to ₹0.04 Cr</li> <li>Other bank balances increased to ₹12.00 Cr (primarily fixed deposits)</li> </ul> <p><strong>Debt:</strong></p> <ul> <li>Current borrowings increased 327% from ₹14.90 Cr to ₹63.66 Cr</li> <li>Non-current borrowings increased from ₹0.06 Cr to ₹2.16 Cr</li> <li>Total debt: ₹65.82 Cr (96.7% is short-term)</li> </ul> <p><strong>Trade Payables:</strong></p> <ul> <li>Total payables increased 192% from ₹8.20 Cr to ₹23.91 Cr</li> </ul> <p><strong>Liquidity Ratios:</strong></p> <ul> <li>Current ratio: 1.30x (March 2025) vs. 1.06x (March 2024)</li> <li>Quick ratio: 0.78x (March 2025) vs. 0.42x (March 2024)</li> </ul> <hr /> <h2><strong>Part 4: Cash Flow Statement</strong></h2> <h3><strong>Cash Flow Summary (FY 2024-25)</strong></h3> <table> <thead> <tr> <th style="text-align: center;"><strong>Activity</strong></th> <th style="text-align: center;"><strong>FY 2023-24</strong></th> <th style="text-align: center;"><strong>FY 2024-25</strong></th> </tr> </thead> <tbody> <tr> <td style="text-align: center;"> </td> <td style="text-align: center;">(7 months)</td> <td style="text-align: center;">(Full year)</td> </tr> <tr> <td style="text-align: center;"><strong>Operating Activities</strong></td> <td style="text-align: center;"> </td> <td style="text-align: center;"> </td> </tr> <tr> <td style="text-align: center;">Profit before tax</td> <td style="text-align: center;">₹16.25 Cr</td> <td style="text-align: center;">₹17.47 Cr</td> </tr> <tr> <td style="text-align: center;">Adjustments (D&A, Finance, etc.)</td> <td style="text-align: center;">₹5.59 Cr</td> <td style="text-align: center;">₹7.28 Cr</td> </tr> <tr> <td style="text-align: center;">Working capital changes</td> <td style="text-align: center;">(₹3.74 Cr)</td> <td style="text-align: center;">(₹9.55 Cr)</td> </tr> <tr> <td style="text-align: center;">Tax paid</td> <td style="text-align: center;">₹0</td> <td style="text-align: center;">(₹1.93 Cr)</td> </tr> <tr> <td style="text-align: center;"><strong>Net from Operations</strong></td> <td style="text-align: center;"><strong>₹16.12 Cr</strong></td> <td style="text-align: center;"><strong>₹13.27 Cr</strong></td> </tr> <tr> <td style="text-align: center;"> </td> <td style="text-align: center;"> </td> <td style="text-align: center;"> </td> </tr> <tr> <td style="text-align: center;"><strong>Investing Activities</strong></td> <td style="text-align: center;"> </td> <td style="text-align: center;"> </td> </tr> <tr> <td style="text-align: center;">Purchase of fixed assets</td> <td style="text-align: center;">(₹5.08 Cr)</td> <td style="text-align: center;">(₹0.93 Cr)</td> </tr> <tr> <td style="text-align: center;">Business acquisition payment</td> <td style="text-align: center;">(₹9.80 Cr)</td> <td style="text-align: center;">(₹51.70 Cr)</td> </tr> <tr> <td style="text-align: center;">Fixed deposits (net)</td> <td style="text-align: center;">₹0.92 Cr</td> <td style="text-align: center;">(₹11.68 Cr)</td> </tr> <tr> <td style="text-align: center;">Other investing activities</td> <td style="text-align: center;">₹0.05 Cr</td> <td style="text-align: center;">₹0.33 Cr</td> </tr> <tr> <td style="text-align: center;"><strong>Net from Investing</strong></td> <td style="text-align: center;"><strong>(₹10.85 Cr)</strong></td> <td style="text-align: center;"><strong>(₹67.80 Cr)</strong></td> </tr> <tr> <td style="text-align: center;"> </td> <td style="text-align: center;"> </td> <td style="text-align: center;"> </td> </tr> <tr> <td style="text-align: center;"><strong>Financing Activities</strong></td> <td style="text-align: center;"> </td> <td style="text-align: center;"> </td> </tr> <tr> <td style="text-align: center;">Equity share issuance</td> <td style="text-align: center;">₹14.47 Cr</td> <td style="text-align: center;">₹4.13 Cr</td> </tr> <tr> <td style="text-align: center;">Borrowings (net increase)</td> <td style="text-align: center;">(₹13.74 Cr)</td> <td style="text-align: center;">₹47.78 Cr</td> </tr> <tr> <td style="text-align: center;">Long-term borrowings</td> <td style="text-align: center;">(₹0.05 Cr)</td> <td style="text-align: center;">₹3.08 Cr</td> </tr> <tr> <td style="text-align: center;">Lease payments</td> <td style="text-align: center;">(₹0.51 Cr)</td> <td style="text-align: center;">(₹0.91 Cr)</td> </tr> <tr> <td style="text-align: center;">Finance costs paid</td> <td style="text-align: center;">(₹1.67 Cr)</td> <td style="text-align: center;">(₹4.58 Cr)</td> </tr> <tr> <td style="text-align: center;"><strong>Net from Financing</strong></td> <td style="text-align: center;"><strong>₹-1.5 Cr</strong></td> <td style="text-align: center;"><strong>₹49.49 Cr</strong></td> </tr> <tr> <td style="text-align: center;"> </td> <td style="text-align: center;"> </td> <td style="text-align: center;"> </td> </tr> <tr> <td style="text-align: center;"><strong>Net Change in Cash</strong></td> <td style="text-align: center;"><strong>₹3.77 Cr</strong></td> <td style="text-align: center;"><strong>(₹5.04 Cr)</strong></td> </tr> </tbody> </table> <h3><strong>Where the Cash Went</strong></h3> <p><strong>Cash inflows:</strong></p> <ul> <li>Operations generated ₹13.27 Cr</li> <li>Short-term borrowings increased by ₹47.78 Cr</li> <li>Equity raised ₹4.13 Cr</li> </ul> <p><strong>Cash outflows:</strong></p> <ul> <li>Business transfer payment: ₹51.70 Cr</li> <li>Fixed deposits: ₹11.68 Cr</li> <li>Finance costs: ₹4.58 Cr</li> <li>Working capital absorption: ₹9.55 Cr</li> </ul> <p><strong>Result:</strong> Cash balance declined from ₹5.08 Cr to ₹0.04 Cr</p> <hr /> <h2><strong>Part 5: Related Party Transactions</strong></h2> <h3><strong>Related Parties</strong></h3> <p>The annual report identifies the following related parties:</p> <p><strong>Holding Company:</strong></p> <ul> <li>RK Eternova Private Limited (formerly Amit Dyechem Private Limited)</li> </ul> <p><strong>Enterprises controlled/significantly influenced by Key Managerial Personnel:</strong></p> <ul> <li>Apollo Green Energy Limited</li> <li>AIL Consultant Private Limited</li> <li>Global Propmart Private Limited</li> <li>OSK Holdings (AIL) Private Limited</li> <li>XTCY World Private Limited</li> <li>Vinayak Infosys Private Limited</li> <li>Adsal Exim Private Limited</li> </ul> <p><strong>Key Managerial Personnel:</strong></p> <ul> <li>Mr. Raaja Kanwar (Chairman)</li> <li>Mr. Shiraz Askari (Wholetime Director)</li> <li>Others as listed in the report</li> </ul> <h3><strong>Related Party Transactions (FY 2024-25)</strong></h3> <table> <thead> <tr> <th style="text-align: center;"><strong>Nature of Transaction</strong></th> <th style="text-align: center;"><strong>Party</strong></th> <th style="text-align: center;"><strong>Amount (₹ Lakhs)</strong></th> </tr> </thead> <tbody> <tr> <td style="text-align: center;"><strong>Sales</strong></td> <td style="text-align: center;">Apollo Green Energy Ltd</td> <td style="text-align: center;">8,336.60</td> </tr> <tr> <td style="text-align: center;"> </td> <td style="text-align: center;">XTCY World Pvt Ltd</td> <td style="text-align: center;">0.10</td> </tr> <tr> <td style="text-align: center;"> </td> <td style="text-align: center;">Mr. Shiraz Askari</td> <td style="text-align: center;">0.29</td> </tr> <tr> <td style="text-align: center;"><strong>Purchases</strong></td> <td style="text-align: center;">Apollo Green Energy Ltd</td> <td style="text-align: center;">11.13</td> </tr> <tr> <td style="text-align: center;"><strong>Job Work</strong></td> <td style="text-align: center;">Apollo Green Energy Ltd</td> <td style="text-align: center;">1.50</td> </tr> <tr> <td style="text-align: center;"><strong>Fabrication Charges</strong></td> <td style="text-align: center;">Apollo Green Energy Ltd</td> <td style="text-align: center;">446</td> </tr> <tr> <td style="text-align: center;"><strong>Rent Paid</strong></td> <td style="text-align: center;">Vinayak Infosys Pvt Ltd</td> <td style="text-align: center;">12.50</td> </tr> <tr> <td style="text-align: center;"> </td> <td style="text-align: center;">Adsal Exim Pvt Ltd</td> <td style="text-align: center;">2.20</td> </tr> <tr> <td style="text-align: center;"><strong>Borrowings Received</strong></td> <td style="text-align: center;">RK Family Trust</td> <td style="text-align: center;">400.00</td> </tr> <tr> <td style="text-align: center;"><strong>Borrowings Repaid</strong></td> <td style="text-align: center;">RK Family Trust</td> <td style="text-align: center;">400.00</td> </tr> <tr> <td style="text-align: center;"><strong>Shares Issued</strong></td> <td style="text-align: center;">Apollo Green Energy Ltd</td> <td style="text-align: center;">3,350.16</td> </tr> <tr> <td style="text-align: center;"> </td> <td style="text-align: center;">RK Family Trust</td> <td style="text-align: center;">400.00</td> </tr> <tr> <td style="text-align: center;"><strong>Director Sitting Fees</strong></td> <td style="text-align: center;">Independent Directors</td> <td style="text-align: center;">4.80</td> </tr> </tbody> </table> <h3><strong>Outstanding Balances (March 31, 2025)</strong></h3> <table> <thead> <tr> <th style="text-align: center;"><strong>Nature</strong></th> <th style="text-align: center;"><strong>Party</strong></th> <th style="text-align: center;"><strong>Amount (₹ Lakhs)</strong></th> </tr> </thead> <tbody> <tr> <td style="text-align: center;"><strong>Trade Receivables</strong></td> <td style="text-align: center;">Apollo Green Energy Ltd</td> <td style="text-align: center;">1,776.32</td> </tr> <tr> <td style="text-align: center;"> </td> <td style="text-align: center;">XTCY World Pvt Ltd</td> <td style="text-align: center;">0.12</td> </tr> <tr> <td style="text-align: center;"> </td> <td style="text-align: center;">Mr. Shiraz Askari</td> <td style="text-align: center;">0.09</td> </tr> <tr> <td style="text-align: center;"><strong>Other Recoverables</strong></td> <td style="text-align: center;">Apollo Green Energy Ltd</td> <td style="text-align: center;">27.73</td> </tr> <tr> <td style="text-align: center;"><strong>Security Deposit</strong></td> <td style="text-align: center;">Vinayak Infosys Pvt Ltd</td> <td style="text-align: center;">7.19</td> </tr> </tbody> </table> <h3><strong>What the Report Says About These Transactions</strong></h3> <p>The annual report notes:</p> <blockquote> <p><em>“As per the Business Transfer Agreement (BTA) with Apollo Green Energy Limited (AGEL), contracts with customers and suppliers are to be transferred to the Company. Until such transfer, AGEL has continued to record revenue and purchases with customers and vendors till the date of transfer on behalf of the Company. During this period, AGEL received payments from customers and made corresponding payments to vendors, and the Company has recognised back-to-back sales and purchases with AGEL to reflect the underlying economic substance. AGEL does not retain any profit margin on these transactions.”</em></p> </blockquote> <p><strong>The receivable from Apollo Green Energy:</strong> ₹17.76 crores represents amounts due from these back-to-back transactions.</p> <hr /> <h2><strong>Part 6: Debt Structure</strong></h2> <h3><strong>Borrowing Details (March 31, 2025)</strong></h3> <p><strong>Non-Current Borrowings:</strong></p> <ul> <li>Vehicle loans from banks and financial institutions: ₹3.14 Cr (gross)</li> <li>Less: Current maturity: ₹0.98 Cr</li> <li><strong>Net non-current borrowings:</strong> ₹2.16 Cr</li> </ul> <p><strong>Current Borrowings:</strong></p> <ul> <li>Cash credit from banks (RBL Bank, ICICI Bank): ₹49.18 Cr</li> <li>Packing credit (export finance): ₹12.57 Cr</li> <li>Factoring facility (Drip Capital): ₹0.93 Cr</li> <li>Current maturity of long-term borrowings: ₹0.98 Cr</li> <li><strong>Total current borrowings:</strong> ₹63.66 Cr</li> </ul> <p><strong>Total Debt:</strong> ₹65.82 Cr</p> <h3><strong>Security and Terms</strong></h3> <p><strong>RBL Bank Limited:</strong></p> <ul> <li>Security: Hypothecation of current assets; second charge on properties owned by Apollo Green Energy Ltd and related entities; personal guarantee of Mr. Raaja Kanwar</li> <li>Interest rate: Repo rate + 5.00%</li> </ul> <p><strong>ICICI Bank Limited:</strong></p> <ul> <li>Security: Charge on fixed deposits; first pari passu charge on movable fixed assets and current assets; corporate guarantee of Apollo Green Energy Ltd; personal guarantee of Mr. Raaja Kanwar</li> <li>Interest rate: Repo rate + 3.00%</li> </ul> <p><strong>Factoring Facility (Drip Capital):</strong></p> <ul> <li>Export bill discounting facility</li> <li>Commission: 0.5% to 5% depending on tenor</li> </ul> <p><strong>Working Capital Limits:</strong> The company has sanctioned working capital limits of ₹65.00 crores from banks (ICICI Bank and RBL Bank).</p> <h3><strong>Debt Ratios (March 31, 2025)</strong></h3> <ul> <li>Debt-to-Equity: 1.33x</li> <li>Gearing Ratio: 57%</li> <li>Net Debt to EBITDA: 2.95x</li> <li>Interest Coverage Ratio: 3.75x</li> </ul> <hr /> <h2><strong>Part 7: Share Capital Changes</strong></h2> <h3><strong>Authorized Share Capital</strong></h3> <p><strong>Increases during FY24-25:</strong></p> <ul> <li>May 15, 2024: Increased by ₹25.00 Cr (50 lakh shares)</li> <li>January 24, 2025: Increased by ₹28.00 Cr (2.80 crore shares)</li> <li><strong>Total authorized capital:</strong> ₹53.00 Cr (5.30 crore shares of ₹10 each)</li> </ul> <h3><strong>Issued Share Capital</strong></h3> <p><strong>Share issuances during FY24-25:</strong></p> <table> <thead> <tr> <th style="text-align: center;"><strong>Date</strong></th> <th style="text-align: center;"><strong>Type</strong></th> <th style="text-align: center;"><strong>Shares</strong></th> <th style="text-align: center;"><strong>Price</strong></th> <th style="text-align: center;"><strong>Amount</strong></th> </tr> </thead> <tbody> <tr> <td style="text-align: center;">April 24, 2024</td> <td style="text-align: center;">Rights Issue</td> <td style="text-align: center;">31,25,000</td> <td style="text-align: center;">₹10</td> <td style="text-align: center;">₹3.13 Cr</td> </tr> <tr> <td style="text-align: center;">May 24, 2024</td> <td style="text-align: center;">Preferential Allotment</td> <td style="text-align: center;">10,00,000</td> <td style="text-align: center;">₹10</td> <td style="text-align: center;">₹1.00 Cr</td> </tr> <tr> <td style="text-align: center;">February 14, 2025</td> <td style="text-align: center;">Preferential Allotment (non-cash)</td> <td style="text-align: center;">1,11,67,200</td> <td style="text-align: center;">₹30</td> <td style="text-align: center;">₹33.50 Cr</td> </tr> </tbody> </table> <p><strong>As of March 31, 2025:</strong></p> <ul> <li>Paid-up capital: ₹29.77 Cr (2.98 crore shares of ₹10 each)</li> </ul> <h3><strong>Shareholding Pattern (March 31, 2025)</strong></h3> <table> <thead> <tr> <th><strong>Shareholder</strong></th> <th><strong>Shares</strong></th> <th><strong>% Holding</strong></th> </tr> </thead> <tbody> <tr> <td>Apollo Green Energy Ltd</td> <td>1,11,67,200</td> <td>37.52%</td> </tr> <tr> <td>RK Eternova Pvt Ltd</td> <td>63,15,386</td> <td>21.22%</td> </tr> <tr> <td>Kanwar Family Admin Services Pvt Ltd</td> <td>25,80,000</td> <td>8.67%</td> </tr> <tr> <td>Mr. Raaja Kanwar</td> <td>15,36,451</td> <td>5.16%</td> </tr> <tr> <td>Mrs. Kamayani Singh Kanwar</td> <td>12,00,002</td> <td>4.03%</td> </tr> <tr> <td>Other promoters/promoter group</td> <td>1,58,161</td> <td>0.53%</td> </tr> <tr> <td><strong>Total Promoter Group</strong></td> <td>~2.29 Cr</td> <td>~77%</td> </tr> <tr> <td><strong>Public Shareholders</strong></td> <td>~0.69 Cr</td> <td>~23%</td> </tr> </tbody> </table> <hr /> <p> </p> <h2><strong>Part 8: Other Disclosures</strong></h2> <h3><strong>Contingent Liabilities</strong></h3> <p>The annual report states there are no significant contingent liabilities as of March 31, 2025.</p> <h3><strong>Capital Commitments</strong></h3> <p>No material capital commitments are disclosed.</p> <h3><strong>Auditor’s Report</strong></h3> <p>The statutory auditors, S S Kothari Mehta & Co. LLP, issued an unqualified audit opinion. The report notes:</p> <ul> <li>They did not audit the financial information of Apollo Green Energy Limited (Fashion Division) for prior periods, which were audited by other auditors</li> <li>There are no defaults in repayment of loans or interest</li> <li>No amounts are required to be transferred to the Investor Education and Protection Fund</li> </ul> <h3><strong>Director’s Report Highlights</strong></h3> <ul> <li>The company’s business operations commenced effectively from June 1, 2024</li> <li>No dividend was declared for the year</li> <li>Audit Committee and Nomination & Remuneration Committee were constituted on December 2, 2024</li> <li>The company is not required to appoint internal auditors, secretarial auditors, or cost auditors</li> <li>No complaints were reported under the Sexual Harassment Act</li> <li>Foreign exchange earnings: ₹67.17 Cr; Foreign exchange outgo: ₹11.33 Cr</li> </ul> <hr /> <h2><strong>Summary</strong></h2> <p>Apollo Fashion International Limited's FY 2024-25 annual report documents a company in its first full year post-demerger, with revenue of ₹182.44 crores and net profit of ₹13.07 crores. The company acquired the fashion division from Apollo Green Energy Limited through a ₹95 crore Business Transfer Agreement (₹61.5 crore cash + ₹33.5 crore in shares) for net assets valued at ₹62.66 crores. The financials show total debt of ₹65.82 crores—96.7% of which is short-term—against equity of ₹49.57 crores, with cash declining from ₹5.08 crores to ₹0.04 crores during the year. Significantly, ₹83.37 crores (45.7% of revenue) came from sales to Apollo Green Energy, with ₹17.76 crores in receivables outstanding from the parent company as of March 31, 2025. The promoter group holds approximately 77% of the equity, with Apollo Green Energy owning 37.52%. Notably, while earlier share issuances during the year were priced at ₹10 per share (face value), the 1.12 crore shares issued to Apollo Green Energy as part of the BTA consideration were priced at ₹30 per share—a valuation basis that remains unexplained in the annual report. The annual report, audited by S S Kothari Mehta & Co. LLP with an unqualified opinion, presents the baseline financial position of a business navigating its transition from subsidiary operations to standalone entity while maintaining substantial commercial relationships with its former parent.</p>

<h3>Introduction</h3> <p>In a strategic move reflecting sharper business focus, <strong>Apollo Green Energy Limited</strong> has officially transferred its <strong>fashion division</strong> to a new entity — <strong>Apollo Fashion International Limited</strong> — under a <strong>Business Transfer Agreement (BTA)</strong>.<br />This transaction marks a key corporate restructuring within the Apollo Group, separating its fashion and renewable energy interests for greater operational independence and value creation.</p> <h3>Background: The Rationale Behind the Transfer</h3> <p>Apollo Green Energy, primarily known for its renewable energy operations, previously housed a growing fashion business manufacturing <strong>footwear, leather garments, and accessories</strong> for global brands.<br />To streamline operations and enable sector-specific growth, Apollo Green <strong>spun out the fashion vertical</strong> into a standalone company — <strong>Apollo Fashion International Limited (AFIL)</strong>.</p> <p>The move aligns with a broader strategy seen across Indian conglomerates — <strong>divesting non-core businesses</strong> to unlock value, attract dedicated investors, and strengthen financial transparency.</p> <h3>Key Highlights of the Business Transfer Agreement</h3> <h4>1. Nature of Transaction</h4> <ul data-spread="false"> <li> <p>The deal is categorized as a <strong>Business Transfer Agreement</strong> and treated as a <strong>common control business combination</strong> under <strong>Ind AS 103</strong>.</p> </li> <li> <p>Both entities remain under the same promoter ownership, but Apollo Fashion now operates as a <strong>separate legal and operational unit</strong>.</p> </li> </ul> <h4>2. Assets and Liabilities Transferred</h4> <p>Apollo Fashion acquired <strong>net assets worth ₹62.66 crore</strong>, including:</p> <ul data-spread="false"> <li> <p><strong>Property, Plant & Equipment:</strong> ₹23.54 crore</p> </li> <li> <p><strong>Inventories:</strong> ₹52.33 crore</p> </li> <li> <p><strong>Trade Receivables:</strong> ₹49.19 crore<br />Offset by:</p> </li> <li> <p><strong>Short-Term Borrowings:</strong> ₹28.76 crore</p> </li> <li> <p><strong>Trade Payables:</strong> ₹30.32 crore</p> </li> <li> <p><strong>Other Liabilities:</strong> Remaining portion</p> </li> </ul> <p>This comprehensive transfer ensures Apollo Fashion inherits the full operating base of the former division — manufacturing facilities, inventories, receivables, and obligations.</p> <h4>3. Deal Consideration</h4> <p>The total deal value stood at <strong>₹95 crore</strong>, comprising both <strong>cash and equity</strong>:</p> <p><img src="https://unlistedzone.com/storage/knowledge-logo/app_image-1762836076.jpg" alt="" width="600" height="365" /></p> <p>The share allotment on <strong>February 14, 2025</strong>, gave Apollo Green Energy a <strong>37.52% equity stake</strong> in Apollo Fashion, ensuring continued strategic alignment.</p> <h4>4. Resulting Capital Reserve</h4> <p>Since the consideration (₹95 crore) exceeded the net assets acquired (₹62.66 crore), Apollo Fashion recorded a <strong>capital reserve of ₹32.34 crore</strong> — a reflection of the premium attributed to the brand value, customer relationships, and business potential of the fashion division.</p> <h3>Operational Continuity and Related Party Transactions</h3> <p>Even after the transfer, <strong>operational interlinkages</strong> remain.</p> <ul data-spread="false"> <li> <p>Around <strong>45.7% of Apollo Fashion’s FY25 revenue</strong> stems from sales to Apollo Green Energy.</p> </li> <li> <p>Until all contracts are fully novated, Apollo Green continues handling certain administrative and supply chain functions <strong>on behalf of Apollo Fashion</strong>, without profit margins.<br />This ensures a <strong>smooth transition</strong> while maintaining commercial continuity.</p> </li> </ul> <h3>Ownership and Corporate Structure</h3> <p>Post-transaction, the <strong>promoter group (including Apollo Green)</strong> collectively holds about <strong>77%</strong> of Apollo Fashion’s equity.<br />This ownership pattern ensures both entities remain strategically aligned, while allowing Apollo Fashion to independently raise capital or pursue partnerships in the fashion domain.</p> <h3>Unlisted Market Performance (as of November 2025)</h3> <p>Both entities — <strong>Apollo Green Energy</strong> and <strong>Apollo Fashion International</strong> — remain <strong>unlisted</strong> but actively trade on leading pre-IPO platforms.</p> <p><img src="https://unlistedzone.com/storage/knowledge-logo/app_image-1762836108.jpg" alt="" width="600" height="277" /></p> <p>Prices are driven by investor sentiment, financial performance, and sector outlooks. The separation enables investors to <strong>value each business independently</strong> — fashion as a consumer growth story, and energy as a sustainable infrastructure play.</p> <h3>Strategic Impact</h3> <ul data-spread="false"> <li> <p><strong>Apollo Green Energy:</strong> Gains sharper focus on its renewable energy expansion, especially in EV charging, solar EPC, and battery tech.</p> </li> <li> <p><strong>Apollo Fashion International:</strong> Benefits from dedicated management, brand partnerships, and operational agility.</p> </li> <li> <p><strong>Investors:</strong> Gain clearer visibility into each segment’s financial performance and risk profile.</p> </li> </ul> <p>This move mirrors a growing corporate trend in India — <strong>unlocking value through business carve-outs</strong> — similar to how conglomerates like Aditya Birla or Tata Group separate sector-specific units.</p> <h3>Conclusion</h3> <p>The Apollo Green–Apollo Fashion restructuring represents a <strong>textbook case of strategic business segregation</strong> under common control.<br />By carving out the fashion division into an independent entity valued at ₹95 crore, the Apollo Group enables <strong>focused growth, cleaner financials, and distinct investor propositions</strong>.</p> <p>While Apollo Green deepens its green energy focus, Apollo Fashion steps forward as a specialized player in India’s fast-growing fashion manufacturing space — both poised to benefit from this realignment.</p>
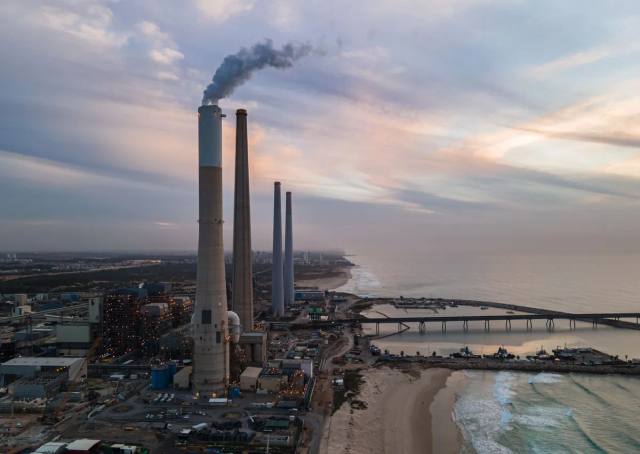
<p>India’s space success isn’t built in the sky — it’s engineered on the ground. Meet Kineco Aerospace, the Goan company behind precision composite components for ISRO’s LVM3-CMS03 mission — including the equipment-bay shroud, wire tunnels, and ITSC closure plates. From autoclaves to cleanrooms, see how ‘Make in India’ manufacturing delivers world-class aerospace composites that withstand extreme temperatures, vibration, and pressure — ensuring every launch flies flawlessly.</p>

<p data-start="582" data-end="865">The name <strong data-start="591" data-end="611">RRP Defense Ltd.</strong> has suddenly started appearing across exchange filings and investor discussions.<br data-start="692" data-end="695" />But behind the new identity lies an older listed company — <strong data-start="754" data-end="780">Euro Asia Exports Ltd.</strong> — that was acquired and renamed before beginning its current wave of transactions.</p> <p data-start="867" data-end="995">Let’s look carefully at how this restructuring unfolded, what’s actually happening inside RRP Defense, and what the numbers say.</p> <hr data-start="997" data-end="1000" /> <h3 data-start="1002" data-end="1050"><strong data-start="1006" data-end="1050">1. From Euro Asia Exports to RRP Defense</strong></h3> <p data-start="1052" data-end="1259">Originally, <strong data-start="1064" data-end="1090">Euro Asia Exports Ltd.</strong> was a small, listed trading company.<br data-start="1127" data-end="1130" />In 2024, a group led by the <strong data-start="1158" data-end="1207">RRP Group (Rajendra Chodankar and associates)</strong> acquired management control of Euro Asia Exports.</p> <p data-start="1261" data-end="1293">After the takeover, the company:</p> <ul data-start="1294" data-end="1521"> <li data-start="1294" data-end="1343"> <p data-start="1296" data-end="1343"><strong data-start="1296" data-end="1316">Changed its name</strong> to <strong data-start="1320" data-end="1340">RRP Defense Ltd.</strong>,</p> </li> <li data-start="1344" data-end="1434"> <p data-start="1346" data-end="1434"><strong data-start="1346" data-end="1378">Altered its business objects</strong> to focus on defence manufacturing and technology, and</p> </li> <li data-start="1435" data-end="1521"> <p data-start="1437" data-end="1521">Began the process of merging other <strong data-start="1472" data-end="1494">RRP group entities</strong> into the listed vehicle.</p> </li> </ul> <p data-start="1523" data-end="1686">In short, this isn’t a newly listed defence manufacturer — it’s an <strong data-start="1590" data-end="1615">existing listed shell</strong> being used as a holding platform to bring in private group businesses.</p> <hr data-start="1688" data-end="1691" /> <h3 data-start="1693" data-end="1746"><strong data-start="1697" data-end="1746">2. The RRP Drones Acquisition (November 2025)</strong></h3> <p data-start="1748" data-end="1927">On <strong data-start="1751" data-end="1772">7th November 2025</strong>, RRP Defense’s Board approved the <strong data-start="1807" data-end="1872">acquisition of 100% equity in RRP Drones Innovation Pvt. Ltd.</strong>, a recently formed drone company based in Navi Mumbai.</p> <p data-start="1929" data-end="1983">The deal was structured as a <strong data-start="1958" data-end="1972">share swap</strong>, not cash:</p> <ul data-start="1984" data-end="2170"> <li data-start="1984" data-end="2066"> <p data-start="1986" data-end="2066"><strong data-start="1986" data-end="2011">1.27 crore new shares</strong> of RRP Defense will be issued at <strong data-start="2045" data-end="2063">₹178 per share</strong>,</p> </li> <li data-start="2067" data-end="2126"> <p data-start="2069" data-end="2126">In exchange for all <strong data-start="2089" data-end="2109">2.83 lakh shares</strong> of RRP Drones.</p> </li> <li data-start="2127" data-end="2170"> <p data-start="2129" data-end="2170">Total consideration: <strong data-start="2150" data-end="2167">₹226.88 crore</strong>.</p> </li> </ul> <p data-start="2172" data-end="2267">After the allotment, <strong data-start="2193" data-end="2245">RRP Drones will become a wholly owned subsidiary</strong> of the listed entity.</p> <hr data-start="2269" data-end="2272" /> <h3 data-start="2274" data-end="2306"><strong data-start="2278" data-end="2306">3. The Valuation Picture</strong></h3> <p data-start="2308" data-end="2348">Before the acquisition, RRP Defense had:</p> <ul data-start="2349" data-end="2485"> <li data-start="2349" data-end="2387"> <p data-start="2351" data-end="2387"><strong data-start="2351" data-end="2384">1.37 crore shares outstanding</strong>,</p> </li> <li data-start="2388" data-end="2420"> <p data-start="2390" data-end="2420"><strong data-start="2390" data-end="2405">Share price</strong> around ₹944,</p> </li> <li data-start="2421" data-end="2485"> <p data-start="2423" data-end="2485"><strong data-start="2423" data-end="2448">Market capitalization</strong> of approximately <strong data-start="2466" data-end="2482">₹1,350 crore</strong>.</p> </li> </ul> <p data-start="2487" data-end="2596">After issuing 1.27 crore new shares for the swap, the total share count will rise to <strong data-start="2572" data-end="2593">2.64 crore shares</strong>.</p> <p data-start="2598" data-end="2761">If we simply add the ₹226.9 crore value of RRP Drones to the existing ₹1,350 crore market cap, the <strong data-start="2697" data-end="2727">combined implied valuation</strong> becomes about <strong data-start="2742" data-end="2758">₹1,575 crore</strong>.</p> <p data-start="2763" data-end="2814">That gives a <strong data-start="2776" data-end="2810">post-deal fair value per share</strong> of:</p> <p><span class="katex-display"><span class="katex"><span class="katex-mathml">₹1,575 crore÷2.64 crore shares=₹595 per share (approx.)</span></span></span></p> <p data-start="2913" data-end="3226">So, even though the current trading price of RRP Defense is ₹944, its <strong data-start="2983" data-end="3014">fair post-acquisition value</strong> works out closer to ₹595 per share.<br data-start="3050" data-end="3053" />This implies that the market is already <strong data-start="3093" data-end="3133">pricing in future growth assumptions</strong> — possibly from upcoming mergers or new defence projects — rather than present fundamentals.</p> <hr data-start="3228" data-end="3231" /> <h3 data-start="3233" data-end="3283"><strong data-start="3237" data-end="3283">4. Upcoming Merger with RRP S4E Innovation</strong></h3> <p data-start="3285" data-end="3523">Alongside this acquisition, the Board also discussed merging another group company, <strong data-start="3369" data-end="3396">RRP S4E Innovation Ltd.</strong>, into RRP Defense.<br data-start="3415" data-end="3418" />A three-member committee has been formed to study the merger structure, valuation, and fairness report.</p> <p data-start="3525" data-end="3575">If approved, the merged company would consolidate:</p> <ul data-start="3576" data-end="3791"> <li data-start="3576" data-end="3650"> <p data-start="3578" data-end="3650"><strong data-start="3578" data-end="3613">RRP Drones Innovation Pvt. Ltd.</strong> – Drone manufacturing and training</p> </li> <li data-start="3651" data-end="3717"> <p data-start="3653" data-end="3717"><strong data-start="3653" data-end="3680">RRP S4E Innovation Ltd.</strong> – Electronics and embedded systems</p> </li> <li data-start="3718" data-end="3791"> <p data-start="3720" data-end="3791"><strong data-start="3720" data-end="3769">RRP Defense Ltd. (formerly Euro Asia Exports)</strong> – The listed parent</p> </li> </ul> <p data-start="3793" data-end="3868">However, no merger ratio or valuation report for S4E has yet been released.</p> <hr data-start="3870" data-end="3873" /> <h3 data-start="3875" data-end="3915"><strong data-start="3879" data-end="3915">5. What This Means for Investors</strong></h3> <p data-start="3917" data-end="4128">RRP Defense’s recent activity is part of a <strong data-start="3960" data-end="4010">reverse acquisition and consolidation strategy</strong> — where an existing listed company is used as a vehicle to bring multiple private entities under one public umbrella.</p> <p data-start="4130" data-end="4205">Such structures are <strong data-start="4150" data-end="4166">not uncommon</strong>, but they often raise questions about:</p> <ul data-start="4206" data-end="4362"> <li data-start="4206" data-end="4263"> <p data-start="4208" data-end="4263">The <strong data-start="4212" data-end="4233">operational scale</strong> of the incoming businesses,</p> </li> <li data-start="4264" data-end="4308"> <p data-start="4266" data-end="4308">The <strong data-start="4270" data-end="4301">justification of valuations</strong>, and</p> </li> <li data-start="4309" data-end="4362"> <p data-start="4311" data-end="4362">The <strong data-start="4315" data-end="4338">actual revenue base</strong> of the merged entity.</p> </li> </ul> <p data-start="4364" data-end="4618">Until the company discloses <strong data-start="4392" data-end="4427">audited consolidated financials</strong> for FY26 post-merger, it will remain difficult to assess whether the current ₹1,350 crore market cap (or the post-deal ₹595/share fair value) reflects business reality or market speculation.</p> <hr data-start="4620" data-end="4623" /> <h3 data-start="4625" data-end="4659"><strong data-start="4629" data-end="4659">6. Snapshot of the Numbers</strong></h3> <p><strong data-start="4629" data-end="4659"><img src="https://unlistedzone.com/storage/knowledge-logo/app_image-1762518575.jpg" alt="" width="652" height="377" /></strong></p> <div class="_tableContainer_1rjym_1"> <div class="group _tableWrapper_1rjym_13 flex w-fit flex-col-reverse" tabindex="-1"> </div> </div> <hr data-start="5075" data-end="5078" /> <h3 data-start="5080" data-end="5101"><strong data-start="5084" data-end="5101">7. Final Word</strong></h3> <p data-start="5103" data-end="5118">To summarize:</p> <ul data-start="5119" data-end="5483"> <li data-start="5119" data-end="5228"> <p data-start="5121" data-end="5228"><strong data-start="5121" data-end="5141">RRP Defense Ltd.</strong> was formerly <strong data-start="5155" data-end="5181">Euro Asia Exports Ltd.</strong>, a listed company acquired by the RRP Group.</p> </li> <li data-start="5229" data-end="5347"> <p data-start="5231" data-end="5347">The new promoters are now consolidating their private ventures — RRP Drones and RRP S4E — into this listed entity.</p> </li> <li data-start="5348" data-end="5483"> <p data-start="5350" data-end="5483">On paper, the combined value after the drone acquisition stands near <strong data-start="5419" data-end="5435">₹1,575 crore</strong>, implying a <strong data-start="5448" data-end="5480">fair per-share value of ₹595</strong>.</p> </li> </ul> <p data-start="5485" data-end="5700">While the structure may look ambitious, investors should watch for <strong data-start="5552" data-end="5618">financial disclosure, audit transparency, and operational data</strong> from these newly merged businesses before assuming this valuation is justified.</p> <p data-start="5702" data-end="5772">At the moment, <strong data-start="5717" data-end="5771">the story is more about restructuring than revenue</strong>.</p>
<p data-source-line="5-5">NSE's latest results reveal the true cost of SEBI's regulatory tightening on derivatives trading. Behind the headline numbers lie two major one-time items that tell a more complex story.</p> <h2 data-source-line="7-7">A) The Headline Numbers</h2> <ul data-source-line="9-12"> <li data-source-line="9-9"><strong>Revenue:</strong> ₹7,709 crore (down 15% YoY)<br /><br /></li> <li data-source-line="10-10"><strong>Reported PAT:</strong> ₹5,022 crore (down 12% YoY)<br /><br /></li> <li data-source-line="11-12"><strong>Operating Margin:</strong> 77% (normalized)</li> </ul> <h2 data-source-line="13-13">B) The Two One-Time Items That Matter</h2> <p data-source-line="15-15"><strong>1. SEBI Settlement Provision: -₹1,297 Crore</strong></p> <p data-source-line="17-17">A one-time charge for the legacy colocation and dark fiber matter from 2015-16. SEBI's approval is still pending.</p> <p data-source-line="19-19"><strong>2. NSDL Stake Sale Profit: +₹1,201 Crore</strong></p> <p data-source-line="21-21">NSE booked a one-time gain from selling its stake in NSDL.</p> <h2 data-source-line="23-23">C) What's the Real Performance?</h2> <p data-source-line="25-25">When you remove both exceptional items, here's the truth:</p> <p data-source-line="27-27"><strong>Normalized Core PAT: ~₹5,092 crore (down 11% from ₹5,704 crore)</strong></p> <p data-source-line="29-29">The core business genuinely took a hit. This isn't just accounting - it's the real impact of SEBI's F&O regulations.</p> <h2 data-source-line="31-31">D) Where's the Pain Coming From?</h2> <h3 id="transaction-charges-collapsed" tabindex="-1" data-source-line="33-33">Transaction Charges Collapsed</h3> <p data-source-line="35-35">Transaction charges fell <strong>18% to ₹5,935 crore</strong>, driven by massive volume declines:</p> <div class="table-container"> </div> <div class="table-container"><img src="https://unlistedzone.com/storage/knowledge-logo/app_image-1762497273.jpg" alt="" width="600" height="377" /></div> <p data-source-line="44-44"><strong>Why?</strong> SEBI's measures to curb speculation:</p> <ul data-source-line="45-50"> <li data-source-line="45-45">Bigger contract sizes<br /><br /></li> <li data-source-line="46-46">Fewer weekly expiries (only one index instead of multiple stocks)<br /><br /></li> <li data-source-line="47-47">Higher margin requirements<br /><br /></li> <li data-source-line="48-48">Stricter position limits<br /><br /></li> <li data-source-line="49-50">Upfront collection mandates</li> </ul> <h3 id="segment-wise-revenue-performance" tabindex="-1" data-source-line="51-51">E) Segment-wise Revenue Performance</h3> <div class="table-container"> </div> <div class="table-container"><img src="https://unlistedzone.com/storage/knowledge-logo/app_image-1762497643.jpg" alt="" width="600" height="404" /></div> <h2 data-source-line="62-62">F) The Good News: Margin Expansion</h2> <p data-source-line="64-64">Despite revenue falling 15%, NSE improved its <strong>operating margin to 77%</strong> from 72% last year.</p> <p data-source-line="66-66"><strong>How?</strong> Expenses (excluding SEBI provision) dropped 26% through:</p> <ul data-source-line="67-70"> <li data-source-line="67-67">Tight cost control<br /><br /></li> <li data-source-line="68-68">Operating leverage from past technology investments<br /><br /></li> <li data-source-line="69-70">Regulatory fees down 36% (linked to lower volumes)</li> </ul> <p data-source-line="71-71">This demonstrates NSE's ability to protect profitability even when revenues decline - a sign of operational excellence.</p> <h2 data-source-line="73-73">G) Market Dominance Still Intact</h2> <p data-source-line="75-75">NSE's monopoly position hasn't changed one bit:</p> <p data-source-line="77-77"><strong>Market Share (Q2 FY2026):</strong></p> <ul data-source-line="78-82"> <li data-source-line="78-78">Cash Market: 92.3%<br /><br /></li> <li data-source-line="79-79">Equity Futures: 99.8%<br /><br /></li> <li data-source-line="80-80">Equity Options: 75.6% (by premium value)<br /><br /></li> <li data-source-line="81-82">Currency Derivatives: 100%</li> </ul> <p data-source-line="83-83"><strong>Global Rankings:</strong></p> <ul data-source-line="84-86"> <li data-source-line="84-84">World's #1 derivatives exchange (by number of contracts)<br /><br /></li> <li data-source-line="85-86">World's #3 equity exchange (by number of trades)</li> </ul> <h2 data-source-line="87-87">H) Capital Markets Remain Healthy</h2> <p data-source-line="89-89">While trading volumes fell, primary markets stayed strong:</p> <ul data-source-line="91-97"> <li data-source-line="91-91"><strong>Total fund mobilization:</strong> ₹9.7 trillion<br /><br /></li> <li data-source-line="92-92"><strong>IPO listings:</strong> 122 (Mainboard & SME)<br /><br /></li> <li data-source-line="93-93"><strong>IPO capital raised:</strong> ₹0.6 trillion<br /><br /></li> <li data-source-line="94-94"><strong>Total investor accounts:</strong> ~24 crore (growing)<br /><br /></li> <li data-source-line="95-95"><strong>Unique investors:</strong> 12+ crore<br /><br /></li> <li data-source-line="96-97"><strong>Listed companies:</strong> 2,856</li> </ul> <p data-source-line="98-98">This shows that while trading activity moderated, India's capital formation story remains intact.</p> <h2 data-source-line="100-100">I) What It Means for NSE Unlisted Share Investors</h2> <p data-source-line="102-102"><strong>Current unlisted market price: ₹1900 per share</strong></p> <h3 id="the-reality-check" tabindex="-1" data-source-line="104-104">The Reality Check</h3> <p data-source-line="106-106"><strong>Positives:</strong></p> <ul data-source-line="107-113"> <li data-source-line="107-107">77% operating margins demonstrate pricing power<br /><br /></li> <li data-source-line="108-108">Market monopoly unchanged across all segments<br /><br /></li> <li data-source-line="109-109">Non-F&O businesses growing strongly (Index +35%, Data +11%)<br /><br /></li> <li data-source-line="110-110">Strong balance sheet with healthy treasury income<br /><br /></li> <li data-source-line="111-111">Long-term India growth story intact<br /><br /></li> <li data-source-line="112-113">Investor base continuing to expand</li> </ul> <p data-source-line="114-114"><strong>Concerns:</strong></p> <ul data-source-line="115-121"> <li data-source-line="115-115">Core profits down 11% - this is a real decline<br /><br /></li> <li data-source-line="116-116">F&O volumes show no recovery signs yet<br /><br /></li> <li data-source-line="117-117">Near-term earnings visibility is weak<br /><br /></li> <li data-source-line="118-118">SEBI settlement outcome still pending<br /><br /></li> <li data-source-line="119-119">Volume recovery timeline uncertain (could take 2-4 quarters)<br /><br /></li> <li data-source-line="120-121">Transaction charges constitute 77% of revenue - heavy concentration</li> </ul> <h3 id="valuation-perspective" tabindex="-1" data-source-line="122-122">J) Valuation Perspective</h3> <p data-source-line="124-124">With normalized EPS of ~₹20.60 for H1 FY26 (annualized ~₹41-42), current unlisted prices imply a <strong>P/E multiple of 47.5x</strong>.</p> <p data-source-line="126-126">This premium valuation assumes:</p> <ul data-source-line="127-132"> <li data-source-line="127-127">Volume recovery within 12-18 months<br /><br /></li> <li data-source-line="128-128">Favorable resolution of SEBI settlement and IPO <br /><br /></li> <li data-source-line="129-129">Continued market dominance<br /><br /></li> <li data-source-line="130-130">Long-term structural growth in Indian capital markets<br /><br /></li> <li data-source-line="131-132">No further regulatory tightening</li> </ul> <p data-source-line="133-133"><strong>Is it justified?</strong></p> <p data-source-line="135-135">For patient, long-term investors who believe in India's financialization story - possibly yes. For those seeking near-term gains or margin of safety - the valuation leaves little room for disappointment.</p> <h2 data-source-line="137-137">H) Quarter-on-Quarter Trends</h2> <p data-source-line="139-139">Q2 FY2026 vs Q1 FY2026 shows continued pressure:</p> <p data-source-line="147-147"><img src="https://unlistedzone.com/storage/knowledge-logo/app_image-1762497788.jpg" alt="" width="600" height="333" /></p> <p data-source-line="147-147">The sequential decline indicates that regulatory impact is still playing out, and volumes haven't found a bottom yet.</p> <h2 data-source-line="149-149">I) The Outlook</h2> <p data-source-line="151-151"><strong>Next 6 months (Short-term):</strong></p> <ul data-source-line="152-156"> <li data-source-line="152-152">F&O volumes likely to remain under pressure<br /><br /></li> <li data-source-line="153-153">Transaction revenues will stay weak<br /><br /></li> <li data-source-line="154-154">Limited earnings growth visibility<br /><br /></li> <li data-source-line="155-156">Focus on cost management to protect margins</li> </ul> <p data-source-line="157-157"><strong>12-24 months (Medium-term):</strong></p> <ul data-source-line="158-163"> <li data-source-line="158-158">Volumes should stabilize at a new equilibrium (lower than pre-regulation levels)<br /><br /></li> <li data-source-line="159-159">Market adapts to new F&O rules<br /><br /></li> <li data-source-line="160-160">Growth comes from investor base expansion rather than trading intensity<br /><br /></li> <li data-source-line="161-161">Non-transaction revenue streams gain importance<br /><br /></li> <li data-source-line="162-163">Potential SEBI settlement resolution</li> </ul> <p data-source-line="164-164"><strong>3+ years (Long-term):</strong></p> <p data-source-line="166-166">Structural growth drivers remain powerful:</p> <ul data-source-line="167-173"> <li data-source-line="167-167">Financialization of Indian household savings<br /><br /></li> <li data-source-line="168-168">Demographic dividend (young population entering investing years)<br /><br /></li> <li data-source-line="169-169">Digital adoption and fintech penetration<br /><br /></li> <li data-source-line="170-170">Passive investing boom (NSE indices dominate)<br /><br /></li> <li data-source-line="171-171">Corporate growth driving capital raising needs<br /><br /></li> <li data-source-line="172-173">Deepening of India's capital markets</li> </ul> <h2 data-source-line="174-174">J) IPO Timeline and Implications</h2> <p data-source-line="176-176">The long-awaited NSE IPO has been delayed primarily due to the colocation matter.</p> <p data-source-line="178-178"><strong>Expected Timeline:</strong> 12-18 months after SEBI settlement approval</p> <p data-source-line="180-180"><strong>Potential IPO Size:</strong> ₹15,000-20,000 crore (likely one of India's largest)</p> <p data-source-line="182-182"><strong>Estimated Valuation:</strong> ₹3.75-4 lakh crore (market conditions dependent)</p> <p data-source-line="184-184"><strong>For unlisted shareholders:</strong> The IPO will provide:</p> <ul data-source-line="185-189"> <li data-source-line="185-185">Exit liquidity opportunity<br /><br /></li> <li data-source-line="186-186">Price discovery in public markets<br /><br /></li> <li data-source-line="187-187">Potential premium to current unlisted rates (depending on market sentiment)<br /><br /></li> <li data-source-line="188-189">Enhanced transparency and regular disclosures</li> </ul> <h2 data-source-line="190-190">K) Key Risks to Monitor</h2> <p data-source-line="192-192"><strong>1. Regulatory Risk:</strong> Further tightening of F&O regulations or new compliance requirements.</p> <p data-source-line="194-194"><strong>2. Volume Risk:</strong> Extended period of low trading activity or permanent structural decline in derivatives trading.</p> <p data-source-line="196-196"><strong>3. Competition Risk:</strong> Though minimal currently, regulatory changes could enable competitors like BSE.</p> <p data-source-line="198-198"><strong>4. Market Cyclicality:</strong> Prolonged bear market could further impact volumes and sentiment.</p> <p data-source-line="200-200"><strong>5. Technology Risk:</strong> Cybersecurity threats, system failures, or disruptive technologies.</p> <p data-source-line="202-202"><strong>6. Execution Risk:</strong> Inability to diversify revenue streams or develop new products.</p> <h2 data-source-line="217-217">L) Investment Verdict</h2> <p data-source-line="219-219"><strong>For existing unlisted shareholders:</strong> Hold position. This is a quality business navigating temporary regulatory headwinds. The fundamental franchise value remains intact.</p> <p data-source-line="221-221"><strong>For fresh buyers at ₹1900-2000:</strong> Exercise caution. Current prices reflect optimistic assumptions about recovery. Better to wait for:</p> <ul data-source-line="222-226"> <li data-source-line="222-222">Clarity on SEBI settlement outcome<br /><br /></li> <li data-source-line="223-223">Signs of volume stabilization (2-3 quarters of data)<br /><br /></li> <li data-source-line="224-224">IPO timeline announcement<br /><br /></li> <li data-source-line="225-226">Better margin of safety</li> </ul> <p data-source-line="227-227"><strong>Best case for fresh entry:</strong> If volumes stabilize by Q4 FY26 and SEBI settlement is concluded favorably, current levels could prove attractive in a 3-5 year perspective.</p> <p data-source-line="229-229"><strong>Risk case:</strong> If F&O volumes decline further or stabilize at permanently lower levels, and if SEBI settlement is harsher than expected, current valuations may be stretched.</p> <h2 data-source-line="231-231">M) The Bottom Line</h2> <p data-source-line="233-233">NSE's H1 FY2026 results show a <strong>genuine 11% decline in core business profits</strong> once you strip away the NSDL sale gain and SEBI provision. This is not accounting noise - it's real business impact from SEBI's F&O regulatory crackdown.</p> <p data-source-line="235-235">Volumes are down <strong>26-30%</strong> across all segments, and there are no immediate signs of recovery. The market is still adjusting to the new regulatory regime, and this process will take time.</p> <p data-source-line="237-237"><strong>However, the fundamental business quality remains exceptional:</strong></p> <ul data-source-line="238-244"> <li data-source-line="238-238">Near-monopoly in all product segments<br /><br /></li> <li data-source-line="239-239">77% operating margins (among the highest globally)<br /><br /></li> <li data-source-line="240-240">Proven ability to protect profitability through cost management<br /><br /></li> <li data-source-line="241-241">Growing diversified revenue streams (index, data, listing)<br /><br /></li> <li data-source-line="242-242">Strong balance sheet and cash generation<br /><br /></li> <li data-source-line="243-244">Positioned at the heart of India's growth story</li> </ul> <p data-source-line="245-245"><strong>The honest assessment:</strong> This is a high-quality monopoly business going through a difficult transition period. The regulatory changes were necessary to protect retail investors from excessive speculation, and NSE is bearing the cost of that social good.</p> <p data-source-line="247-247">For long-term investors who can handle 2-3 quarters of earnings weakness and believe in India's long-term capital markets growth, NSE remains compelling. The current moderation in volumes is real, but the structural story hasn't changed.</p> <p data-source-line="249-249">For those seeking near-term returns or margin of safety, current unlisted prices at 100x earnings offer limited cushion against further disappointment.</p> <p data-source-line="251-251"><strong>NSE will remain what it always was - India's financial market infrastructure backbone. Just growing slower than before, which is the price of a more responsible and sustainable derivatives market.</strong></p> <hr data-source-line="282-282" /> <p data-source-line="284-284"><strong>Disclaimer:</strong> This article is for informational purposes only and does not constitute investment advice. NSE unlisted shares are illiquid securities with limited price discovery and high risk. Past performance is not indicative of future results. Investors should conduct thorough due diligence and consult qualified financial advisors before making any investment decisions. The author may or may not hold positions in the securities discussed.</p> <p data-source-line="286-286"><strong>Source:</strong> NSE Investor Presentation Q2 | H1 FY2026, dated November 4, 2025</p>

<div id="shorts-panel-container" class="style-scope ytd-shorts"> <div id="anchored-panel" class="anchored-panel style-scope ytd-shorts"> <div id="content" class="style-scope ytd-engagement-panel-section-list-renderer"> <div id="items" class="style-scope ytd-structured-description-content-renderer"> <div id="snippet" class="style-scope ytd-text-inline-expander"><span id="snippet-text" class="style-scope ytd-text-inline-expander"><span id="plain-snippet-text" class="style-scope ytd-text-inline-expander">Bira 91 pledged its Beer Café shares to raise a loan — but after failing to repay, Japan’s Kirin Holdings and Anicut Capital have taken control.</span></span></div> <div id="source-attributions-wrapper" class="style-scope ytd-expandable-video-description-body-renderer"></div> </div> </div> <div id="footer" class="style-scope ytd-engagement-panel-section-list-renderer"></div> </div> </div> <div class="navigation-container style-scope ytd-shorts"> <div id="navigation-button-up" class="navigation-button style-scope ytd-shorts"> <div class="yt-spec-button-shape-next__icon" aria-hidden="true"> <div> </div> </div> </div> </div>

<p>India’s wealth management scene is evolving fast! Platforms like Wint Wealth, InCred Money, and Dezerv are taking investing beyond mutual funds and FDs, giving access to corporate bonds, unlisted shares, and alternative assets.</p>
Indicative prices, company research and your enquiries — in your pocket. Get price notes on the names you follow and reach our team from anywhere.