Blogs, insights, guides and videos on India's unlisted market — all in one place.
<p data-start="182" data-end="569"><strong data-start="182" data-end="206">B9 Beverages Limited</strong>, popularly known for its craft beer brand <strong data-start="249" data-end="260">Bira 91</strong>, has called for an <strong data-start="280" data-end="319">Extraordinary General Meeting (EGM)</strong> on <strong data-start="323" data-end="344">September 3, 2025</strong> to approve key strategic financial decisions. These moves directly impact the company’s <strong data-start="433" data-end="495">capital structure, debt position, and liquidity management</strong> – making it a crucial update for investors in <strong data-start="542" data-end="566">Bira unlisted shares</strong>.</p> <h2 data-start="576" data-end="612"><strong data-start="579" data-end="610">Key Proposals at Bira’s EGM</strong></h2> <h3 data-start="614" data-end="694"><strong data-start="618" data-end="692">1. Capital Reclassification and Amendment of Memorandum of Association</strong></h3> <p data-start="695" data-end="951">Bira plans to <strong data-start="709" data-end="752">reclassify its authorised share capital</strong> by cancelling certain classes of unissued preference shares and increasing the equity share capital. This change will also involve altering <strong data-start="893" data-end="905">Clause V</strong> of the company’s Memorandum of Association.</p> <ul data-start="952" data-end="1085"> <li data-start="952" data-end="1085"> <p data-start="954" data-end="1085"><strong data-start="954" data-end="975">Why this matters:</strong> It simplifies the capital structure and could make it easier for the company to raise equity in the future.</p> </li> </ul> <h3 data-start="1092" data-end="1189"><strong data-start="1096" data-end="1187">2. Issuance of Non-Convertible Debentures (NCDs) to BCG – Consideration Other Than Cash</strong></h3> <p data-start="1190" data-end="1336">The company will issue <strong data-start="1213" data-end="1239">NCDs worth ₹8.66 crore</strong> to <strong data-start="1243" data-end="1288">Boston Consulting Group (India) Pvt. Ltd.</strong> as payment for consultancy services provided.</p> <ul data-start="1337" data-end="1470"> <li data-start="1337" data-end="1470"> <p data-start="1339" data-end="1470"><strong data-start="1339" data-end="1355">Implication:</strong> Instead of paying cash, Bira is opting for a debt instrument, preserving liquidity while still compensating BCG.</p> </li> </ul> <h3 data-start="1477" data-end="1582"><strong data-start="1481" data-end="1580">3. Fundraising via Optionally Convertible Debentures (OCDs) to Dharampal Satyapal Limited (DSL)</strong></h3> <p data-start="1583" data-end="1677">Bira proposes to raise <strong data-start="1606" data-end="1627">₹31 crore in cash</strong> from DSL through the private placement of OCDs.</p> <ul data-start="1678" data-end="1768"> <li data-start="1678" data-end="1768"> <p data-start="1680" data-end="1768"><strong data-start="1680" data-end="1692">Purpose:</strong> To meet <strong data-start="1701" data-end="1734">general business requirements</strong> and strengthen working capital.</p> </li> </ul> <h3 data-start="1775" data-end="1858"><strong data-start="1779" data-end="1856">4. Issuance of Equity Shares to Creditors – Consideration Other Than Cash</strong></h3> <p data-start="1859" data-end="1992">Bira plans to issue <strong data-start="1879" data-end="1919">equity shares worth up to ₹100 crore</strong> to its creditors, effectively converting outstanding dues into equity.</p> <ul data-start="1993" data-end="2114"> <li data-start="1993" data-end="2114"> <p data-start="1995" data-end="2114"><strong data-start="1995" data-end="2006">Impact:</strong> This will reduce trade payables, improve the balance sheet, and lower debt levels without a cash outflow.</p> </li> </ul> <h2 data-start="2121" data-end="2170"><strong data-start="2124" data-end="2168">What This Means for Bira’s Cash Position</strong></h2> <p data-start="2172" data-end="2244">The proposed actions show a clear focus on <strong data-start="2215" data-end="2241">liquidity preservation</strong>:</p> <ul data-start="2246" data-end="2472"> <li data-start="2246" data-end="2309"> <p data-start="2248" data-end="2309"><strong data-start="2248" data-end="2276">Payment to BCG via NCDs:</strong> Avoids immediate cash expense.</p> </li> <li data-start="2310" data-end="2398"> <p data-start="2312" data-end="2398"><strong data-start="2312" data-end="2356">Conversion of creditor dues into equity:</strong> Settles liabilities without using cash.</p> </li> <li data-start="2399" data-end="2472"> <p data-start="2401" data-end="2472"><strong data-start="2401" data-end="2432">Fresh fundraising via OCDs:</strong> Brings in cash for operational needs.</p> </li> </ul> <p data-start="2474" data-end="2700">This approach signals that while Bira is actively managing liabilities, it may also be facing <strong data-start="2568" data-end="2598">tight cash flow conditions</strong> – a common scenario for high-growth consumer brands that invest heavily in expansion and marketing.</p> <h2 data-start="2707" data-end="2768"><strong data-start="2710" data-end="2766">Investor Takeaways – Bira Unlisted Share Perspective</strong></h2> <p data-start="2770" data-end="2923">For investors in <strong data-start="2787" data-end="2811">Bira unlisted shares</strong>, this EGM update is critical for assessing the company’s <strong data-start="2869" data-end="2920">financial health and future valuation potential</strong>:</p> <ul data-start="2925" data-end="3475"> <li data-start="2925" data-end="3040"> <p data-start="2927" data-end="3040"><strong data-start="2927" data-end="2959">Balance Sheet Strengthening:</strong> Debt-to-equity profile could improve as liabilities are converted into equity.</p> </li> <li data-start="3041" data-end="3200"> <p data-start="3043" data-end="3200"><strong data-start="3043" data-end="3068">Liquidity Management:</strong> Company is prioritising cash preservation – a positive for sustaining operations, but it also hints at possible cash constraints.</p> </li> <li data-start="3201" data-end="3349"> <p data-start="3203" data-end="3349"><strong data-start="3203" data-end="3228">Equity Dilution Risk:</strong> Issuing shares to creditors will expand the equity base, potentially impacting per-share valuations in the short term.</p> </li> <li data-start="3350" data-end="3475"> <p data-start="3352" data-end="3475"><strong data-start="3352" data-end="3379">Strategic Partnerships:</strong> DSL’s investment via OCDs suggests continued institutional confidence in Bira’s growth story.</p> </li> </ul> <h2 data-start="3482" data-end="3501"><strong data-start="3485" data-end="3499">Conclusion</strong></h2> <p data-start="3503" data-end="3811">Bira’s upcoming EGM represents a <strong data-start="3536" data-end="3563">strategic restructuring</strong> of its capital base while balancing liquidity needs. For <strong data-start="3621" data-end="3654">Bira unlisted share investors</strong>, it’s important to track the execution of these proposals and monitor the company’s ability to convert this financial manoeuvring into sustainable growth.</p> <p data-start="3813" data-end="3994">As the Indian craft beer market continues to expand, Bira’s <strong data-start="3873" data-end="3938">brand strength, funding support, and balance sheet discipline</strong> will play a pivotal role in its eventual IPO journey.</p>
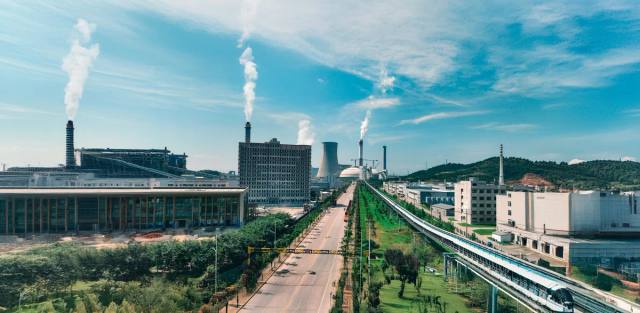
<p>EU sanctions have hit Nayara Energy — disrupting crude payments, exports, and insurance. Here’s how the Rosneft-backed refiner is navigating the crisis, what operational changes are happening, and the key takeaways for investors.</p>
<p>Ramaraju Surgical Cotton Mills Limited, part of the renowned Ramco Group, has released its Q1 FY26 (June 2025) financial results, offering a detailed view of the company’s performance across segments. Known for absorbent cotton, surgical products, and premium cotton yarn, the company delivered strong revenue growth but continues to face profitability challenges.</p> <h2><strong>A) Company Overview</strong></h2> <p>Founded in 1939 in Rajapalayam, Tamil Nadu, Ramaraju Surgical Cotton Mills Limited is one of Southern India’s largest producers of absorbent cotton, gauze, and wound-care products. Alongside its surgical offerings, it manufactures premium cotton yarns for shirting, bed linens, and Jacquard cloth, catering to both domestic and international markets.</p> <h2><strong>B) Q1 FY26 vs Q1 FY25 Financial Highlights</strong></h2> <h2><strong><img src="https://unlistedzone.com/storage/knowledge-logo/app_image-1754997764.jpg" alt="" width="800" height="640" /></strong></h2> <h3><strong>Key Observations:</strong></h3> <ul data-spread="false"> <li> <p><strong>Revenue Growth:</strong> Up nearly <strong>15% YoY</strong>, driven by strong textile demand.</p> </li> <li> <p><strong>EBITDA Loss Reduction:</strong> Improved from -17.87% margin to -9.13%, showing better cost control.</p> </li> <li> <p><strong>Net Loss Impact:</strong> Slightly widened YoY due to increased expenses.</p> </li> </ul> <h2><strong>C) Segment-Wise Performance</strong></h2> <h2><strong><img src="https://unlistedzone.com/storage/knowledge-logo/app_image-1754998323.jpg" alt="" width="800" height="280" /></strong></h2> <h3><strong>Insights:</strong></h3> <ul data-spread="false"> <li> <p><strong>Textiles:</strong> Revenue surged <strong>18.5% YoY</strong>, maintaining dominance in overall sales.</p> </li> <li> <p><strong>Surgical Products:</strong> Sales dropped <strong>7.9% YoY</strong>, suggesting competition or pricing pressures.</p> </li> <li> <p><strong>Wind Energy:</strong> Revenue jumped <strong>42% YoY</strong>, strengthening diversification efforts.</p> </li> </ul> <h2><strong>D) Investor Takeaways</strong></h2> <ul data-spread="false"> <li> <p><strong>Positive:</strong> Strong revenue momentum led by textiles; margin improvement is a healthy sign.</p> </li> <li> <p><strong>Challenges:</strong> Net loss persists; surgical segment decline needs strategic intervention.</p> </li> <li> <p><strong>Opportunities:</strong> Expanding renewable energy operations could become a steady revenue stream.</p> </li> </ul> <p>For more information Visit: <a href="https://unlistedzone.com/shares/buy-sell-share-price-ramaraju-surgical-cotton-mills-limited-unlisted-shares/">UnlistedZone</a></p> <p><strong>Conclusion</strong></p> <p>Ramaraju Surgical Cotton Mills posted a robust revenue growth in Q1 FY26, primarily driven by textiles and wind energy gains. However, profitability remains under pressure, and the dip in surgical product sales calls for renewed strategic focus. The company’s success will hinge on balancing cost control with market expansion in the coming quarters.</p> <p><strong>Disclaimer:</strong> <em>UnlistedZone is not a SEBI-registered Research Analyst or Investment Advisor. All information shared is for educational purposes only. We do not provide any buy/sell recommendations. Investors should do their own due diligence or consult a SEBI-registered advisor before making investment decisions. Investments in unlisted and pre-IPO shares are subject to market risks, including liquidity risk.</em></p>
<p>Axles India’s FY25 results are out — sales stayed flat, profit dipped 20%, but operating cash flow jumped 3x thanks to smart inventory moves. Is this a sign of financial strength or a value trap?</p>

<p><strong>State Bank of India (SBI)</strong> Chairman C.S. Setty has signalled that <strong>SBI General Insurance</strong> and <strong>SBI Mutual Fund</strong> are strong contenders for public listing. While no IPO timeline is set, both are under active consideration.</p> <p>The statement came during the launch of SBI General Insurance’s first dedicated health insurance branches in Telangana and Andhra Pradesh, with plans for a nationwide rollout.</p> <h2>SBI General Insurance – Health-Focused Expansion</h2> <p> </p> <h2><img src="https://unlistedzone.com/storage/knowledge-logo/app_image-1754899114.jpg" alt="" width="900" height="648" /></h2> <p>SBI General Insurance is opening <strong>specialised health insurance branches</strong> to increase penetration in underserved markets. Setty aims to position the company as <em>“the health insurer for every Indian.”</em> This move complements SBI’s broader vision of serving every household in the country.</p> <p><strong>More Details:</strong> <a href="https://unlistedzone.com/shares/sbi-general-insurance-unlisted-shares/">SBI General Insurance Unlisted Shares</a></p> <h2>SBI Mutual Fund – AMC Market Leader</h2> <p> </p> <h2><img src="https://unlistedzone.com/storage/knowledge-logo/app_image-1754899153.jpg" alt="" width="900" height="648" /></h2> <p>SBI Mutual Fund is India’s largest Asset Management Company by Assets Under Management (AUM). Its retail reach and market dominance make it a top candidate for a high-value IPO, potentially one of the biggest in the financial services sector.</p> <p><strong>More Details:</strong><a href="https://unlistedzone.com/shares/sbi-mutual-fund-unlisted-shares/"> SBI Mutual Fund Unlisted Shares</a></p> <h2>IPO Plans – Awaiting Timelines</h2> <p>Setty confirmed that while both companies are “strong candidates for listing,” no schedule has been decided. For unlisted market investors, this means IPOs are likely but may take time.</p> <h2>Bancassurance & Customer Focus</h2> <p>Bancassurance — a bank selling insurance products through its network — remains a core strength for SBI General Insurance. Setty emphasised the importance of offering <strong>need-based, suitable insurance products</strong> and improving accessibility, with efforts involving regulators, banks, and insurers.</p> <h3>Investor Takeaways</h3> <ul data-spread="false"> <li> <p>Both companies operate in high-growth sectors — insurance and asset management.</p> </li> <li> <p>SBI General Insurance’s health branch strategy could drive market share gains.</p> </li> <li> <p>SBI Mutual Fund’s AMC leadership could attract significant IPO demand.</p> </li> <li> <p>No IPO timelines announced; these remain long-term watchlist opportunities.</p> </li> <li> <p>Currently, SBI General Insurance unlisted shares are unavailable; SBI Mutual Fund shares are available but at higher valuations than listed peers.</p> </li> </ul> <p><strong>Disclaimer:</strong> UnlistedZone is not a SEBI-registered Research Analyst or Investment Advisor.All information shared on our platform—including articles, posts, investment insights, and price trends—is solely for educational and informational purposes. We do not provide any buy/sell recommendations or financial advice.Investors are advised to do their own due diligence or consult a SEBI-registered advisor before making any investment decisions. Investments in unlisted and pre-IPO shares are subject to market risks, including liquidity risk and price volatility.UnlistedZone does not guarantee any returns and shall not be held liable for any losses incurred as a result of investment decisions taken based on the information provided.</p>

<p>Discover how market coupling could transform India’s power sector by integrating electricity trading across exchanges, improving efficiency, lowering costs, and fostering competition — and what it means for players like IEX, PXIL, and HPX.</p>

<h3><strong>A) Introduction: GH2 Solar Limited – Powering India's Green Energy Future</strong></h3> <p>Founded in 1995 and officially incorporated in March 2013 as a public entity, GH2 Solar Limited is a Noida-based renewable energy company transforming India’s clean energy landscape. With a workforce of approximately 54 employees as of April 2025, the company has established itself as a pioneer in solar EPC, commercial and industrial (C&I) open-access power solutions, green hydrogen production, and electrolyzer manufacturing.</p> <h3><strong>B) Business Overview and Services</strong></h3> <p>GH2 Solar delivers integrated renewable energy services tailored for industrial and commercial clients across India. Their expertise spans:</p> <ul data-spread="false"> <li> <p><strong>Solar EPC Projects</strong>: Custom installation and operation services</p> </li> <li> <p><strong>Open-Access Energy Models</strong>: Enabling bulk power procurement and cost-effective clean energy</p> </li> <li> <p><strong>Green Hydrogen Solutions</strong>: End-to-end systems including electrolyzer manufacturing and mobility applications</p> </li> <li> <p><strong>Flexible Financing</strong>: Models such as Power Purchase Agreements (PPA) and open-access for scalability</p> </li> </ul> <p>With a focus on turnkey project delivery, GH2 ensures seamless execution from design to commissioning, empowering clients to adopt sustainable solutions with ease.</p> <h3><strong>C) Leadership and Management Team</strong></h3> <ul data-spread="false"> <li> <p><strong>Anurag Jain</strong>, Founder & CEO, brings over 14 years of experience in the renewable energy space.</p> </li> <li> <p><strong>Kapil Agrawal</strong>, CFO, has 18+ years of financial leadership experience.</p> </li> <li> <p><strong>Anuj Mathur</strong>, Head of Green Hydrogen, boasts 22 years of experience and credentials from ISB and IIT BHU.</p> </li> <li> <p>The board also includes Aditi Jain, Vepul Jain, and other newly appointed directors in 2025.</p> </li> </ul> <h3><strong>D) Strategic Projects & Milestones</strong></h3> <p>GH2 Solar has achieved notable success through key projects such as:</p> <ul data-spread="false"> <li> <p><strong>Green Hydrogen Demo Plant</strong>: Commissioned at V.O. Chidambaranar Port, Tamil Nadu</p> </li> <li> <p><strong>SECI Tender Win</strong>: Secured contract for 105MW electrolyzer manufacturing capacity</p> </li> <li> <p><strong>Recognition under SECI’s SIGHT Program</strong>: Cementing its place in India’s decarbonization journey</p> </li> </ul> <h3><strong>E) Financial Performance Snapshot (FY 2022–2024)</strong></h3> <p><strong>Profit & Loss Statement Highlights (INR Cr)</strong></p> <table> <tbody> <tr> <th style="text-align: center;"><strong>Particulars</strong></th> <th style="text-align: center;"><strong>2022</strong></th> <th style="text-align: center;"><strong>2023</strong></th> <th style="text-align: center;"><strong>2024</strong></th> </tr> <tr> <td style="text-align: center;">Revenue</td> <td style="text-align: center;">17.31</td> <td style="text-align: center;">61.72</td> <td style="text-align: center;">64.77</td> </tr> <tr> <td style="text-align: center;">EBITDA</td> <td style="text-align: center;">0.95</td> <td style="text-align: center;">1.68</td> <td style="text-align: center;">5.47</td> </tr> <tr> <td style="text-align: center;">EBIT</td> <td style="text-align: center;">0.84</td> <td style="text-align: center;">1.56</td> <td style="text-align: center;">5.39</td> </tr> <tr> <td style="text-align: center;">PAT</td> <td style="text-align: center;">0.585</td> <td style="text-align: center;">0.93</td> <td style="text-align: center;">3.46</td> </tr> <tr> <td style="text-align: center;">EPS (₹)</td> <td style="text-align: center;">153.95</td> <td style="text-align: center;">244.74</td> <td style="text-align: center;">10.03</td> </tr> <tr> <td style="text-align: center;">Gross Margin %</td> <td style="text-align: center;">15.31</td> <td style="text-align: center;">6.95</td> <td style="text-align: center;">23.3</td> </tr> <tr> <td style="text-align: center;">EBITDA Margin %</td> <td style="text-align: center;">5.49</td> <td style="text-align: center;">2.72</td> <td style="text-align: center;">8.45</td> </tr> <tr> <td style="text-align: center;">PBT Margin %</td> <td style="text-align: center;">4.59</td> <td style="text-align: center;">2.09</td> <td style="text-align: center;">7.7</td> </tr> <tr> <td style="text-align: center;">NPM %</td> <td style="text-align: center;">3.38</td> <td style="text-align: center;">1.51</td> <td style="text-align: center;">5.34</td> </tr> </tbody> </table> <p> </p> <p><strong>Balance Sheet Summary (INR Cr)</strong></p> <table style="width: 39.5106%;"> <tbody> <tr> <td style="width: 50.5722%; text-align: center;"><strong>Assets/Liabilities</strong></td> <td style="width: 16.6058%; text-align: center;"><strong>2022</strong></td> <td style="width: 16.6058%; text-align: center;"><strong>2023</strong></td> <td style="width: 16.6058%; text-align: center;"><strong>2024</strong></td> </tr> <tr> <td style="width: 50.5722%; text-align: center;">Total Assets</td> <td style="width: 16.6058%; text-align: center;">10.36</td> <td style="width: 16.6058%; text-align: center;">20.1</td> <td style="width: 16.6058%; text-align: center;">52.52</td> </tr> <tr> <td style="width: 50.5722%; text-align: center;">Trade Receivables</td> <td style="width: 16.6058%; text-align: center;">9.77</td> <td style="width: 16.6058%; text-align: center;">11.65</td> <td style="width: 16.6058%; text-align: center;">40.5</td> </tr> <tr> <td style="width: 50.5722%; text-align: center;">Share Capital</td> <td style="width: 16.6058%; text-align: center;">0.038</td> <td style="width: 16.6058%; text-align: center;">0.038</td> <td style="width: 16.6058%; text-align: center;">3.45</td> </tr> <tr> <td style="width: 50.5722%; text-align: center;">Reserves</td> <td style="width: 16.6058%; text-align: center;">2.62</td> <td style="width: 16.6058%; text-align: center;">3.55</td> <td style="width: 16.6058%; text-align: center;">3.59</td> </tr> <tr> <td style="width: 50.5722%; text-align: center;">Borrowings</td> <td style="width: 16.6058%; text-align: center;">1.6</td> <td style="width: 16.6058%; text-align: center;">3.71</td> <td style="width: 16.6058%; text-align: center;">5.85</td> </tr> </tbody> </table> <p> </p> <p><strong>Cash Flow Highlights (INR Lakhs )</strong></p> <table> <tbody> <tr> <td style="text-align: center;"><strong>Category</strong></td> <td style="text-align: center;"><strong>2022</strong></td> <td style="text-align: center;"><strong>2023</strong></td> <td style="text-align: center;"><strong>2024</strong></td> </tr> <tr> <td style="text-align: center;">Cash From Ops</td> <td style="text-align: center;">-3.5</td> <td style="text-align: center;">-177</td> <td style="text-align: center;">130</td> </tr> <tr> <td style="text-align: center;">Cash From Investing</td> <td style="text-align: center;">-41</td> <td style="text-align: center;">-11</td> <td style="text-align: center;">-248</td> </tr> <tr> <td style="text-align: center;">Cash From Financing</td> <td style="text-align: center;">42</td> <td style="text-align: center;">184</td> <td style="text-align: center;">394</td> </tr> <tr> <td style="text-align: center;">Net Cash Generated</td> <td style="text-align: center;">-2.5</td> <td style="text-align: center;">-4</td> <td style="text-align: center;">276</td> </tr> </tbody> </table> <h3> </h3> <h3><strong>F) Key Financial Ratios and Valuation Metrics</strong></h3> <ul data-spread="false"> <li> <p><strong>P/E Ratio</strong>: 68.24</p> </li> <li> <p><strong>P/B Ratio</strong>: 33.05</p> </li> <li> <p><strong>Debt to Equity Ratio</strong>: 0.83</p> </li> <li> <p><strong>ROE</strong>: 49.15%</p> </li> <li> <p><strong>Book Value</strong>: ₹16.64</p> </li> </ul> <p><strong>Shareholding & Equity Timeline:</strong></p> <ul data-spread="false"> <li> <p>31 March 2024: 4,58,000 shares</p> </li> <li> <p>4 April 2024: +1,82,000 shares @ ₹217/share = ₹3.94 Cr</p> </li> <li> <p>20 April 2025: +2,02,217 shares @ ₹217/share = ₹4.38 Cr</p> </li> <li> <p>14 Nov 2025: +4,47,950 shares @ ₹523/share = ₹23.42 Cr</p> </li> <li> <p><strong>Total Shares as of Nov 2025</strong>: 42,90,167</p> </li> <li> <p><strong>Market Cap</strong>: ₹236 Cr at ₹550/share</p> </li> </ul> <h3><strong>G) Strategic Strengths and Market Positioning</strong></h3> <p>GH2 Solar is positioned to ride India’s green hydrogen and renewable energy wave. Future expansions include:</p> <ul data-spread="false"> <li> <p><strong>Electrolyzer Manufacturing Facility</strong></p> </li> <li> <p><strong>Hydrogen Mobility Infrastructure</strong></p> </li> <li> <p><strong>C&I-Focused Open Access Projects</strong></p> </li> </ul> <p>With strong government alignment and private investor interest, GH2 Solar is uniquely equipped to drive India’s decarbonization goals.</p> <ul data-spread="false"> <li> <p><strong>Vertical Integration</strong>: Strong control over project quality and delivery timeline</p> </li> <li> <p><strong>Government Backing</strong>: Recognition by SECI ensures trust and scalability</p> </li> <li> <p><strong>Cost-Effective Service Delivery</strong>: Customized energy models for high-efficiency deployment</p> </li> <li> <p><strong>Targeted Focus on Industrial & Commercial Sector</strong>: Enhances revenue consistency and growth predictability</p> </li> </ul> <h3><strong>Conclusion: GH2 Solar – A Clean Energy Catalyst</strong></h3> <p>GH2 Solar is redefining renewable energy delivery in India through a blend of innovation, strategic partnerships, and robust project execution. As a SECI-recognized player with a strong valuation trajectory, the company is well-poised to lead India's transition to a cleaner, greener, and more self-reliant energy future.</p>

<h2><strong>Introduction: Why This Matters to You</strong></h2> <p>Imagine you are running a massive oil refinery in India. You import crude oil from Russia, refine it in India, and then sell the fuel to international buyers. Simple?</p> <p>Not anymore.</p> <p>Nayara Energy — one of India’s largest private oil refiners with over 20 million tonnes of capacity — is facing serious trouble because of <em>global politics</em>. And if you're an investor in the unlisted space, especially through platforms like UnlistedZone, this is your live case study on <strong>geopolitical risk</strong>, <strong>banking systems</strong>, and <strong>why due diligence is more than just reading numbers</strong>.</p> <p>Let’s break it down, simply, clearly, and with real-world perspective.</p> <div><hr /></div> <h2>A) How Nayara Energy’s Business Works: Crude to Cash</h2> <p>Before we understand the problem, let’s understand the business model in <strong>three easy steps</strong>:</p> <h3>1. <strong>Crude Oil Import from Russia</strong></h3> <ul data-spread="false"> <li> <p>Nayara buys <strong>crude oil</strong> from Russia.</p> </li> <li> <p>Russia gives a discount due to geopolitical isolation, making it attractive for Indian buyers.</p> </li> </ul> <h3>2. <strong>Refining in India</strong></h3> <ul data-spread="false"> <li> <p>The crude is brought to Nayara’s Vadinar refinery (Gujarat).</p> </li> <li> <p>It is refined into usable fuel — like petrol, diesel, aviation turbine fuel.</p> </li> </ul> <h3>3. <strong>Export of Refined Fuel</strong></h3> <ul data-spread="false"> <li> <p>A portion of this refined fuel is exported to countries like Oman, UAE, etc.</p> </li> <li> <p>These international buyers make <strong>payments in USD or Euro</strong> through global financial systems.</p> </li> </ul> <p>All these payments — for imports and exports — go through <strong>global banks</strong> like HSBC, Citi, Standard Chartered etc. That’s where the problem begins.</p> <div><hr /></div> <h2>B) The Root Problem: EU Sanctions on Russia</h2> <p>In July 2025, the <strong>European Union imposed new sanctions</strong> targeting companies that have Russian shareholding. Nayara Energy, where Russia’s <strong>Rosneft owns a 49% stake</strong>, was affected.</p> <p>Here’s what happened next:</p> <h3>Foreign Banks Stopped Supporting Transactions</h3> <ul data-spread="false"> <li> <p>Foreign banks <strong>refused to process payments</strong> for Nayara’s crude purchases from Russia.</p> </li> <li> <p>Insurance support for cargo shipments also <strong>got disrupted</strong>.</p> </li> <li> <p>Even payments <strong>from foreign buyers</strong> for refined exports started getting <strong>delayed</strong> or <strong>blocked</strong>.</p> </li> </ul> <p>Why?</p> <p>Because global banks feared <strong>secondary sanctions</strong> — a penalty for doing business with a Russia-linked entity.</p> <p>This means Nayara couldn’t:</p> <ul data-spread="false"> <li> <p>Pay Russia for crude on time</p> </li> <li> <p>Receive money for exports</p> </li> <li> <p>Insure its cargo smoothly</p> </li> </ul> <div><hr /></div> <h2>C) Enter UCO Bank: A Potential Desi Solution</h2> <p>Faced with this international block, Nayara turned to <strong>Indian financial channels</strong>. The idea? To use a bank with <strong>less exposure to global sanctions</strong>.</p> <h3>Why UCO Bank?</h3> <ul data-spread="false"> <li> <p><strong>UCO Bank is government-owned</strong>, with a relatively smaller international footprint.</p> </li> <li> <p>It had earlier handled <strong>oil trade with Iran</strong>, another country under Western sanctions.</p> </li> <li> <p>It already has a <strong>system for rupee-trade-based settlements</strong>.</p> </li> </ul> <p>Nayara is now in talks with the <strong>Finance Ministry</strong> and UCO Bank to:</p> <ul data-spread="false"> <li> <p>Process payments for Russian crude using <strong>INR-based settlements</strong></p> </li> <li> <p>Receive export payments from friendly countries via alternate channels</p> </li> </ul> <p><strong>Important</strong>: As of now, no final tie-up has happened. Discussions are in <strong>initial stages</strong>.</p> <div><hr /></div> <h2>D) How Will UCO Bank Help? A Simple Analogy</h2> <p>Let’s say:</p> <ul data-spread="false"> <li> <p>You’re trying to send money to your cousin who lives in a country that’s blocked on all major payment apps.</p> </li> <li> <p>But you have an old-school local courier guy who has previously delivered parcels in that region.</p> </li> </ul> <p>That courier is <strong>UCO Bank</strong>. Because it is <strong>not deeply linked with Western financial systems</strong>, it can work <strong>under the radar</strong> — using alternate mechanisms like:</p> <ul data-spread="false"> <li> <p><strong>Vostro Accounts</strong> (holding rupee balances of foreign banks)</p> </li> <li> <p><strong>INR-Ruble payment arrangements</strong></p> </li> <li> <p><strong>SWIFT alternatives like SPFS</strong> (Russia’s version of SWIFT)</p> </li> </ul> <p>These systems can help Nayara:</p> <ul data-spread="false"> <li> <p>Continue crude imports from Russia</p> </li> <li> <p>Sell refined fuel to markets not following EU sanctions</p> </li> <li> <p>Keep cash flow moving without using Western banks</p> </li> </ul> <div><hr /></div> <h2>E) Operational Adjustments Made by Nayara</h2> <p>Due to the payment and insurance disruptions:</p> <ul data-spread="false"> <li> <p>Nayara has <strong>cut refinery operations</strong> to 80% of capacity.</p> </li> <li> <p>Export logistics have been <strong>carefully managed</strong>, with the <strong>first post-sanction shipment sent to Oman</strong> (43,000 metric tons of gasoline).</p> </li> <li> <p>Meanwhile, Nayara is diversifying markets and exploring <strong>non-dollar payment systems</strong>.</p> </li> </ul> <div><hr /></div> <h2>F) <strong>Investor Insights: What Can You Learn from This?</strong></h2> <p>If you are an investor in <strong>pre-IPO</strong> or <strong>unlisted</strong> markets, here are your key takeaways:</p> <h3>1. <strong>Geopolitical Risk Is Real</strong></h3> <ul data-spread="false"> <li> <p>Even if a company performs well financially, <strong>ownership structure</strong> can invite international risk.</p> </li> <li> <p>Investors must check not just financials but also <strong>who owns the company</strong>.</p> </li> </ul> <h3>2. <strong>Alternative Systems Are Valuable</strong></h3> <ul data-spread="false"> <li> <p>Companies with <strong>access to flexible financial systems</strong> or <strong>government support</strong> are better placed to survive shocks.</p> </li> </ul> <h3>3. <strong>Valuation Pressure</strong></h3> <ul data-spread="false"> <li> <p>Due to uncertainty and perceived risk, companies like Nayara may face <strong>valuation discount</strong> in the unlisted space.</p> </li> <li> <p>Such factors must be considered before entering or exiting a position.</p> </li> </ul> <h3>4. <strong>Role of Policy and Diplomacy</strong></h3> <ul data-spread="false"> <li> <p>Indian government’s willingness to help Nayara shows that <strong>policy support can be a defensive moat</strong> for some companies.</p> </li> </ul> <div><hr /></div> <h2>Conclusion: A Case Study Every Investor Must Know</h2> <p>Nayara Energy is not just a company in trouble — it is a <strong>textbook example</strong> of how <strong>global events</strong> can ripple into your <strong>portfolio</strong>.</p> <p>Its current crisis teaches us:</p> <ul data-spread="false"> <li> <p>How the <strong>international financial system</strong> can choke operational cash flows</p> </li> <li> <p>Why <strong>local solutions</strong> like UCO Bank matter</p> </li> </ul>

<p>In a major leadership transition at API Holdings, the parent company of digital health unicorn <strong>PharmEasy</strong>, co-founder and CEO <strong>Siddharth Shah</strong> has stepped down from his executive position. <strong>Rahul Guha</strong>, who currently serves as CEO of Thyrocare and President of Operations at API, has been appointed the new <strong>Managing Director and CEO</strong> of API Holdings, effective <strong>August 27, 2025</strong>.</p> <p>This development comes amidst a broader reshuffle at API Holdings, following the exit of all other co-founders earlier this year.</p> <h3>A) The End of an Era: Last Co-Founder Steps Down</h3> <p>Siddharth Shah was the <strong>last remaining operational co-founder</strong> of API Holdings after <strong>Dharmil Sheth, Dhaval Shah, Harsh Parekh</strong>, and <strong>Hardik Dedhia</strong> exited their executive roles earlier in 2025. Shah will now take on the more strategic position of <strong>Vice Chairman</strong>, signaling a complete handover of daily operations to a professional leadership team.</p> <p>This marks a pivotal moment in the journey of PharmEasy, which once stood as one of India’s most promising health-tech unicorns.</p> <h3>B) Leadership Transition: Who is Rahul Guha?</h3> <p><strong>Rahul Guha</strong> has played a critical role in managing operations across API’s group companies. Currently leading <strong>Thyrocare</strong>, one of India’s top diagnostic chains acquired by PharmEasy in 2021, Guha also served as <strong>President of Operations at API Holdings</strong>, where he worked on driving operational efficiencies and synergies across business verticals.</p> <p>According to an internal communication reviewed by <strong>Moneycontrol</strong>, Guha will <strong>continue as CEO of Thyrocare</strong> while taking on the top job at API Holdings.</p> <h3>C) Why the Restructuring Now?</h3> <p>This leadership overhaul is part of a <strong>broader strategic reset</strong> triggered after a steep <strong>valuation markdown</strong> in 2024.</p> <ul data-spread="false"> <li> <p>In FY24, API Holdings revenue fell 15% YoY to INR 5564 Cr</p> </li> <li> <p>However, net losses were halved to 2533 Cr through aggressive cost-cutting</p> </li> <li> <p>PharmEasy’s valuation dropped from <strong>$5.6 billion to just $700 million</strong> during a $216 million down round led by Manipal Group’s Ranjan Pai, Prosus, and others in April 2024</p> </li> </ul> <p>This period also saw a <strong>freeze on the company’s long-planned IPO</strong>, which was initially filed in 2021 but later withdrawn in 2022.</p> <h3>D) Focus Ahead: Diagnostics, Profitability, IPO?</h3> <p>With Guha at the helm and Shah stepping into a strategic advisory role, the focus is now on:</p> <ul data-spread="false"> <li> <p><strong>Operational streamlining</strong> across verticals (pharmacy + diagnostics)</p> </li> <li> <p><strong>Improving unit economics</strong> and profitability</p> </li> <li> <p><strong>Potential revival of IPO plans</strong>, although a timeline has not yet been revealed</p> </li> </ul> <p>The dual leadership—Guha driving execution and Shah guiding vision—could help revive investor confidence and restore PharmEasy’s position in the Indian health-tech space.</p> <h3>E) UnlistedZone Insights</h3> <ol start="1" data-spread="false"> <li> <p><strong>Professionalization of leadership</strong> is a clear sign that PharmEasy is preparing for long-term sustainability and possibly revisiting IPO ambitions.</p> </li> <li> <p>The sharp <strong>valuation correction from $5.6B to $700M</strong> underlines investor caution and the need for solid financial performance before returning to public markets.</p> </li> <li> <p><strong>Guha’s operational experience</strong>, especially from Thyrocare, may help navigate the complex landscape of Indian healthcare and diagnostics more efficiently.</p> </li> </ol> <p> </p> <h3>Final Thoughts</h3> <p>PharmEasy’s leadership shakeup signals the end of its founding chapter and the beginning of a <strong>new, professionally managed era</strong>. As the company rebuilds after valuation turbulence and prepares for its next growth phase, all eyes will be on Rahul Guha’s ability to deliver results.</p> <p>For investors tracking the <strong>unlisted space</strong>, PharmEasy remains a key player to watch—especially if the company successfully reboots its IPO strategy in the coming years.</p> <h3><strong>Disclaimer :</strong> </h3> <p>UnlistedZone is not a SEBI-registered Research Analyst or Investment Advisor.All information shared on our platform—including articles, posts, investment insights, and price trends—is solely for educational and informational purposes. We do not provide any buy/sell recommendations or financial advice.Investors are advised to do their own due diligence or consult a SEBI-registered advisor before making any investment decisions. Investments in unlisted and pre-IPO shares are subject to market risks, including liquidity risk and price volatility.UnlistedZone does not guarantee any returns and shall not be held liable for any losses incurred as a result of investment decisions taken based on the information provided.</p>
<p>The <strong>Finance Ministry and SEBI</strong> are currently in advanced talks to <strong>curb speculative trading in the options market</strong>, a move that could directly impact the National Stock Exchange (NSE). One major reform under consideration is the <strong>complete discontinuation of weekly expiry contracts</strong>, including those for <strong>Nifty 50</strong> — currently the only index with such an option on NSE.</p> <p>This initiative builds upon a major regulatory step SEBI took last year, which already impacted NSE’s derivatives volumes.</p> <div><hr /></div> <h2>A) Event 1: SEBI’s 2024 Rule — One Index, One Weekly Expiry</h2> <p>On <strong>November 20, 2024</strong>, SEBI implemented a rule that <strong>limited weekly derivatives contracts to only one benchmark index per exchange</strong>.</p> <p>What changed?</p> <ul data-spread="false"> <li> <p><strong>Bank Nifty</strong>, <strong>FinNifty</strong>, and <strong>Midcap Nifty</strong> all lost their weekly expiries.</p> </li> <li> <p>Only <strong>Nifty 50</strong> retained the right to continue weekly options.</p> </li> <li> <p>The rest shifted to <strong>monthly expiries</strong>, typically on the last Thursday of each month.</p> </li> </ul> <p>This was aimed at <strong>reducing intraday volatility</strong> and discouraging speculative frenzy in short-dated options.</p> <div><hr /></div> <h2>B) Event 2: SEBI Now Plans Full Ban on Weekly Expiry</h2> <p>Now in 2025, SEBI is reportedly planning the next phase of reform:</p> <ul data-spread="false"> <li> <p><strong>Completely end weekly options contracts</strong>, including Nifty 50.</p> </li> <li> <p>Introduce <strong>bi-monthly or monthly expiries</strong> instead.</p> </li> <li> <p><strong>Lower margin requirements</strong> in the cash segment.</p> </li> <li> <p>Recommend <strong>reduction in Securities Transaction Tax (STT)</strong> to promote delivery-based equity trading.</p> </li> </ul> <p>The idea is simple: <strong>shift market participation from speculative trades to long-term equity ownership.</strong></p> <div><hr /></div> <h2>C) NSE’s Revenue Model: Derivatives Drive the Engine</h2> <p>Over <strong>60–70% of NSE’s revenues</strong> come from <strong>transaction charges</strong>, with derivatives (especially weekly options) being the biggest contributors.</p> <p>The following impacts are anticipated:</p> <ul data-spread="false"> <li> <p><strong>Reduced trading volumes in derivatives</strong> if weekly options are completely banned.</p> </li> <li> <p><strong>Fall in transaction fees</strong>, which will weigh on short-term earnings.</p> </li> <li> <p>Lower volatility may reduce speculative arbitrage, impacting high-frequency trading activity.</p> </li> </ul> <p>So yes — in the <strong>short term</strong>, this is <strong>negative for NSE’s topline</strong>.</p> <div><hr /></div> <h2>D) Long-Term Positive: Boosting the Cash Market</h2> <p>SEBI’s reform package isn’t just about restrictions. It also includes <strong>pro-market initiatives</strong>:</p> <ul data-spread="false"> <li> <p><strong>Lowering STT</strong> on delivery trades makes cash investments more cost-effective.</p> </li> <li> <p><strong>Reducing margins</strong> in the cash segment encourages broader participation.</p> </li> <li> <p>Less speculation could boost <strong>confidence among long-term investors and institutions</strong>.</p> </li> </ul> <p>This shift could help NSE:</p> <ul data-spread="false"> <li> <p>Diversify revenue from derivatives to equity trading.</p> </li> <li> <p>Increase IPO listings and related income.</p> </li> <li> <p>Expand its data and analytics offerings.</p> </li> </ul> <div><hr /></div> <h2>E) What Should Unlisted NSE Shareholders Do?</h2> <table style="width: 68.8595%; height: 73.3333px;"> <tbody> <tr style="height: 18.3333px;"> <th style="text-align: center; width: 16.4317%; height: 18.3333px;">Timeline</th> <th style="text-align: center; width: 28.0834%; height: 18.3333px;">Impact on NSE</th> <th style="text-align: center; width: 55.4198%; height: 18.3333px;">Implication for Unlisted Investors</th> </tr> <tr style="height: 36.6667px;"> <td style="text-align: center; width: 16.4317%; height: 36.6667px;">Short-Term</td> <td style="text-align: center; width: 28.0834%; height: 36.6667px;">Revenue dip from options ban</td> <td style="text-align: center; width: 55.4198%; height: 36.6667px;">Possible correction in unlisted share valuation</td> </tr> <tr style="height: 18.3333px;"> <td style="text-align: center; width: 16.4317%; height: 18.3333px;">Long-Term</td> <td style="text-align: center; width: 28.0834%; height: 18.3333px;">Balanced, diversified revenue model</td> <td style="text-align: center; width: 55.4198%; height: 18.3333px;">Likely stable and sustainable growth</td> </tr> </tbody> </table> <p>So, if there's a temporary valuation dip in the unlisted space, it might just be the <strong>right time to accumulate NSE shares</strong>.</p> <div><hr /></div> <h2>F) Final Thoughts</h2> <p>SEBI’s move to end weekly options expiry is a <strong>structural reform</strong>. While it may <strong>dampen NSE’s income temporarily</strong>, it paves the way for a <strong>more mature and fundamentally driven equity market</strong>. Investors in NSE’s unlisted shares should closely watch how the cash market volumes evolve in response.</p>
<h2><strong>1. BUSINESS OVERVIEW</strong></h2> <p>Axles India Limited, a joint venture between Wheels India( 9.51% ), Sundaram Finance (38.32% ), and Dana Holding Corporation (USA)(48.33%), is a prominent manufacturer of axle housings for medium and heavy commercial vehicles (M&HCVs). With two manufacturing facilities in Sriperumbudur and Cheyyar (Tamil Nadu), the company has a production capacity of 280,000 axle housings annually. Serving leading OEMs like Tata Motors, Ashok Leyland, Daimler India, and export clients including Dana USA and Volvo Asia, Axles India stands as a vital supplier in the commercial vehicle component space.</p> <h2><strong>2. FINANCIAL PERFORMANCE</strong></h2> <table> <tbody> <tr> <th>Metric</th> <th>FY22</th> <th>FY23</th> <th>FY24</th> <th>FY25</th> </tr> <tr> <td>Revenue (₹ Cr)</td> <td>569</td> <td>746</td> <td>854</td> <td>841</td> </tr> <tr> <td>EBITDA (₹ Cr)</td> <td>54</td> <td>85</td> <td>129</td> <td>101</td> </tr> <tr> <td>EBITDA Margin (%)</td> <td>9.49</td> <td>11.39</td> <td>15.11</td> <td>12.01</td> </tr> <tr> <td>PAT (₹ Cr)</td> <td>34</td> <td>53</td> <td>86</td> <td>69</td> </tr> <tr> <td>PAT Margin (%)</td> <td>5.98</td> <td>7.1</td> <td>10.07</td> <td>8.2</td> </tr> <tr> <td>EPS (₹)</td> <td>13.34</td> <td>20.79</td> <td>33.74</td> <td>27.07</td> </tr> <tr> <td>Gross Margin (%)</td> <td>36.38</td> <td>35.92</td> <td>32.55</td> <td>43.04</td> </tr> </tbody> </table> <h2><strong>3. BALANCE SHEET STRENGTH</strong></h2> <table> <tbody> <tr> <td>Metric</td> <td>FY22</td> <td>FY23</td> <td>FY24</td> <td>FY25</td> </tr> <tr> <td>Total Assets (₹ Cr)</td> <td>371</td> <td>416</td> <td>518</td> <td>519</td> </tr> <tr> <td>Trade Receivables (₹ Cr)</td> <td>174</td> <td>215</td> <td>202</td> <td>191</td> </tr> <tr> <td>Inventory (₹ Cr)</td> <td>104</td> <td>123</td> <td>210</td> <td>179</td> </tr> <tr> <td>Borrowings (₹ Cr)</td> <td>58</td> <td>54</td> <td>82</td> <td>50</td> </tr> <tr> <td>Reserves (₹ Cr)</td> <td>150</td> <td>186</td> <td>249</td> <td>282</td> </tr> </tbody> </table> <h2><strong>4. CASH FLOW ANALYSIS</strong></h2> <table> <tbody> <tr> <td>Metric</td> <td>FY22</td> <td>FY23</td> <td>FY24</td> <td>FY25</td> </tr> <tr> <td>Cash Flow from Ops (₹ Cr)</td> <td>13</td> <td>18</td> <td>32</td> <td>118</td> </tr> <tr> <td>Cash Flow from Investing</td> <td>-10</td> <td>-14</td> <td>-31</td> <td>-33</td> </tr> <tr> <td>Cash Flow from Financing</td> <td>-19</td> <td>-15</td> <td>3</td> <td>-4</td> </tr> <tr> <td>Net Cash Generated (₹ Cr)</td> <td>-16</td> <td>-11</td> <td>4</td> <td>19</td> </tr> </tbody> </table> <h2><strong>5. RATIO ANALYSIS (FY22–FY25)</strong></h2> <table> <tbody> <tr> <td>Ratio</td> <td>FY22</td> <td>FY23</td> <td>FY24</td> <td>FY25</td> </tr> <tr> <td>Debt to Equity</td> <td>0.27</td> <td>0.23</td> <td>0.25</td> <td>0.16</td> </tr> <tr> <td>Return on Equity (%)</td> <td>17.2</td> <td>21.0</td> <td>28.5</td> <td>22.44</td> </tr> <tr> <td>Return on Capital Employed (ROCE %)</td> <td>14.5</td> <td>18.1</td> <td>24.8</td> <td>20.2</td> </tr> <tr> <td>EPS (₹)</td> <td>13.34</td> <td>20.79</td> <td>33.74</td> <td>27.07</td> </tr> <tr> <td>Current Ratio</td> <td>2.14</td> <td>2.20</td> <td>2.11</td> <td>2.28</td> </tr> </tbody> </table> <h2><strong>6. VALUATION ANALYSIS(FY25)</strong></h2> <table> <tbody> <tr> <td>Metric</td> <td>Value</td> </tr> <tr> <td>Market Cap (₹ Cr)</td> <td>1,912</td> </tr> <tr> <td>Share Price (₹)</td> <td>750</td> </tr> <tr> <td>Book Value (₹)</td> <td>124.55</td> </tr> <tr> <td>P/E Ratio</td> <td>27.71</td> </tr> <tr> <td>P/B Ratio</td> <td>6.02</td> </tr> <tr> <td>EV/EBITDA </td> <td>18.9</td> </tr> </tbody> </table> <h3><strong>Insights:</strong></h3> <ul data-spread="false"> <li> <p><strong>Strong Earnings Base:</strong> EPS has grown consistently over the years, peaking in FY24 at ₹33.74. Even with a slight drop to ₹27.07 in FY25, it reflects a resilient earnings base.</p> </li> <li> <p><strong>Efficient Capital Utilization:</strong> ROE and ROCE show the company is efficiently using shareholders’ capital and total capital employed, with ROE peaking at 28.5% in FY24.</p> </li> <li> <p><strong>Deleveraging:</strong> The debt-to-equity ratio dropped from 0.27 in FY22 to just 0.16 in FY25, indicating a strong balance sheet and reduced interest burden.</p> </li> <li> <p><strong>Strong Liquidity Position:</strong> The current ratio has remained above 2x across all years, suggesting sufficient liquidity to meet short-term obligations.</p> </li> <li> <p><strong>Valuation Multiples:</strong> With a P/E of 27.71 and P/B of 6.02, the stock commands premium valuations, likely reflecting investor confidence in future growth and stability.</p> </li> <li> <p><strong>Stable Gross Margins:</strong> Despite fluctuations in revenue, gross margins have held strong, reaching 43% in FY25 — a sign of improving cost efficiencies or favorable product mix.</p> </li> </ul> <p><br /><strong>CONCLUSION</strong><br />Axles India Limited continues to deliver robust performance, backed by a solid business model and strategic joint ventures. With strong profitability, healthy balance sheet metrics, and consistent cash flows, the company remains well-positioned in the commercial vehicle components space. Its valuations reflect investor optimism, supported by low debt, strong margins, and a diversified client base in both domestic and export markets.</p> <p> </p> <p><strong>DISCLAIMER</strong><br />UnlistedZone is not a SEBI-registered Research Analyst or Investment Advisor.All information shared on our platform—including articles, posts, investment insights, and price trends—is solely for educational and informational purposes. We do not provide any buy/sell recommendations or financial advice.Investors are advised to do their own due diligence or consult a SEBI-registered advisor before making any investment decisions. Investments in unlisted and pre-IPO shares are subject to market risks, including liquidity risk and price volatility.UnlistedZone does not guarantee any returns and shall not be held liable for any losses incurred as a result of investment decisions taken based on the information provided.</p>
Indicative prices, company research and your enquiries — in your pocket. Get price notes on the names you follow and reach our team from anywhere.