Blogs, insights, guides and videos on India's unlisted market — all in one place.

<p>Explanantion with proper context and a Q&A format: <strong>Market Coupling in Power Sector: Industry Flags Execution Risks</strong></p> <div><hr /></div> <h2>1) Context: What Is Market Coupling in Power Sector?</h2> <p>In India, electricity is traded on three main exchanges:</p> <ul data-spread="false"> <li> <p><strong>IEX (Indian Energy Exchange)</strong> – has ~90% market share.</p> </li> <li> <p><strong>PXIL (Power Exchange India Ltd.)</strong></p> </li> <li> <p><strong>HPX (Hindustan Power Exchange)</strong></p> </li> </ul> <p>Currently, buyers and sellers choose which exchange to trade on. But there's a problem: <strong>IEX has all the liquidity</strong>, so naturally, everyone prefers it. The newer exchanges struggle.</p> <p>To solve this, the government proposed <strong>market coupling</strong> — where a central system will collect all bids from all exchanges, match the best buy/sell offers, and declare a <strong>single price</strong> for electricity across India.</p> <p>This system is designed to improve:</p> <ul data-spread="false"> <li> <p><strong>Transparency</strong></p> </li> <li> <p><strong>Price discovery</strong></p> </li> <li> <p><strong>Fair competition</strong></p> </li> </ul> <div><hr /></div> <h2>2) Q&A: Challenges in Implementing Market Coupling</h2> <div><hr /></div> <h3><strong>Q1: What is market coupling trying to solve?</strong></h3> <p><strong>Problem:</strong> All buyers go to IEX because it has more sellers, and vice versa. New exchanges can’t grow.</p> <p><strong>Solution</strong>: Pool all trades in one place (like UPI for power), and let a neutral operator match the best rates - regardless of which exchange you placed the order on.</p> <div><hr /></div> <h3><strong>Q2: Sounds good. So why is the industry worried?</strong></h3> <p>The industry - especially <strong>IEX and big participants -</strong> are worried about <strong>how</strong> this will be implemented. Concerns include:</p> <div><hr /></div> <h3><strong>Q3: Who will run this central system?</strong></h3> <p><strong>Challenge</strong>: The current proposal gives control to the <strong>Grid Controller of India Ltd.</strong> (state-owned). Exchanges fear this may lead to:</p> <ul data-spread="false"> <li> <p><strong>Conflict of interest</strong></p> </li> <li> <p><strong>Slow response time</strong></p> </li> <li> <p><strong>Lack of commercial innovation</strong></p> </li> </ul> <p>They want a <strong>neutral, independent operator</strong>, not a government body.</p> <div><hr /></div> <h3><strong>Q4: Will it affect the business model of exchanges like IEX?</strong></h3> <p>Yes.</p> <ul data-spread="false"> <li> <p>Currently, exchanges make money from <strong>high trading volumes</strong>.</p> </li> <li> <p>If all trades are pooled and matched centrally, <strong>liquidity is no longer an edge</strong>.</p> </li> <li> <p>IEX fears it may lose its dominance, and <strong>revenues could fall</strong>.</p> </li> </ul> <div><hr /></div> <h3><strong>Q5: Are there international examples of this?</strong></h3> <p>Yes, Europe uses market coupling for cross-border electricity trade. But:</p> <ul data-spread="false"> <li> <p>Those are <strong>mature, digitally advanced markets</strong>.</p> </li> <li> <p>India still has <strong>transmission bottlenecks</strong>, <strong>data latency</strong>, and <strong>state-level complications</strong>.</p> </li> </ul> <p>So <strong>copy-pasting the model may not work</strong> without groundwork.</p> <div><hr /></div> <h3><strong>Q6: What's the risk for investors and consumers?</strong></h3> <ul data-spread="false"> <li> <p>If poorly implemented, it may <strong>disrupt power availability or pricing</strong> in short-term markets.</p> </li> <li> <p>For companies like <strong>IEX</strong>, it could <strong>impact growth and profitability</strong>.</p> </li> <li> <p>For new players like PXIL and HPX, it’s a <strong>potential game-changer</strong>, but only if execution is clean.</p> </li> </ul> <div><hr /></div> <h2>Bottom Line</h2> <p>Market coupling <strong>can democratize power trading</strong> in India — making it fairer, more efficient, and technology-driven.</p> <p>But for it to succeed:</p> <ul data-spread="false"> <li> <p>Governance must be <strong>transparent and independent</strong>.</p> </li> <li> <p>Implementation must be <strong>technically sound and phased</strong>.</p> </li> <li> <p>Concerns of dominant players like IEX must be <strong>acknowledged but not allowed to block reform</strong>.</p> </li> </ul>

<p>NSE ne Q1 FY26 mein ₹2,924 crore ka net profit kamaya, revenue thoda gira lekin market activity strong rahi! Valuation aur IPO ke prospects par detailed breakdown dekho. Kya aap NSE IPO ka wait kar rahe ho?</p>

<p><strong>A One Steels India Limited (ASIPL)</strong>, founded in <strong>2012</strong>, is a <strong>Southern India-based steel manufacturer</strong> with <strong>6 plants</strong> (5 in Karnataka, 1 in Andhra Pradesh). Its <strong>fully integrated operations</strong>—from iron ore to finished products—give it a <strong>cost and quality edge</strong>. The company makes <strong>TMT bars, coils, pipes, and sponge iron</strong>, and is expanding into <strong>stainless steel</strong>.</p> <p>With <strong>84-87% green energy use</strong>, <strong>1,200+ retail outlets</strong>, and <strong>top-5 rank in South India</strong>, ASIPL is now preparing for a <strong>₹650 crore IPO</strong> (₹600cr fresh issue + ₹50cr OFS) to grow further. <strong>A strong, efficient player</strong> in India's steel sector.</p> <h3><strong>A) Market Position (FY24) & Sustainability Initiatives</strong></h3> <ul data-spread="false"> <li> <p><strong>Top 5</strong> crude steel producers in Southern India</p> </li> <li> <p><strong>Market Share:</strong> 0.27% of India's total crude steel output</p> </li> <li> <p><strong>~1%</strong> share in the domestic pipe segment (CRISIL Report)</p> </li> <li> <p><strong>USP:</strong> Only player in the region offering diversified steel and industrial products under one brand</p> </li> <li> <p><strong>Renewable Energy Use:</strong> 84–87% from solar, wind, and Wi-RBs</p> </li> <li> <p><strong>Certifications:</strong> CII Green Product Certification for Fe550 D CRS TMT bars</p> </li> <li> <p>Upcoming Projects: 10 MW Wi-RB Power Plant & 300,000 MTPA Iron Ore Beneficiation Plant (by FY26)</p> </li> </ul> <h3><strong>B) Product Portfolio</strong></h3> <p>A One Steels India Limited (ASIPL) manufactures a diverse range of <strong>steel products across four key categories</strong>. The company produces high-grade <strong>TMT bars (Fe 550D CRS, Fe 500D CRS, Fe 550 CRS)</strong> under its long steel segment. Its <strong>flat steel portfolio includes HR/CR coils, HR/CR pipes and galvanized pipes</strong>. For industrial applications, ASIPL offers <strong>MS billets, sponge iron, met coke, ferro silicon and silicon manganese.</strong> The company is currently <strong>developing stainless steel wire rods at its Koppal facility, marking its entry into premium steel products.</strong> This vertically integrated product range enables ASIPL <strong>to serve construction, infrastructure and industrial sectors with comprehensive steel solutions</strong> while maintaining strict quality control across all manufacturing stages.</p> <p><strong>Product-Wise Revenue Split</strong></p> <table> <tbody> <tr> <td style="text-align: center;">Product</td> <td style="text-align: center;">3M FY25</td> <td style="text-align: center;">FY24</td> <td style="text-align: center;">FY23</td> <td style="text-align: center;">FY22</td> </tr> <tr> <td style="text-align: center;">Pipes & Tubes</td> <td style="text-align: center;">21.77%</td> <td style="text-align: center;">18.92%</td> <td style="text-align: center;">16.54%</td> <td style="text-align: center;">19.83%</td> </tr> <tr> <td style="text-align: center;">TMT Bars</td> <td style="text-align: center;">32.12%</td> <td style="text-align: center;">29.18%</td> <td style="text-align: center;">30.30%</td> <td style="text-align: center;">26.94%</td> </tr> <tr> <td style="text-align: center;">Sponge Iron</td> <td style="text-align: center;">12.96%</td> <td style="text-align: center;">12.74%</td> <td style="text-align: center;">14.23%</td> <td style="text-align: center;">18.54%</td> </tr> </tbody> </table> <h3><strong>C) Manufacturing & Logistics</strong></h3> <ul data-spread="false"> <li> <p><strong>Plants:</strong> Gauribidanur, Bellary (2 units), Koppal, Chikkantapur (Karnataka), and Hindupur (Andhra Pradesh)</p> </li> </ul> <p><strong>Geographical Revenue Split</strong></p> <table style="width: 45.0115%; height: 166.154px;"> <tbody> <tr style="height: 36.9231px;"> <td style="width: 32.1064%; height: 36.9231px; text-align: center;">State</td> <td style="width: 18.0238%; height: 36.9231px; text-align: center;">3M FY25</td> <td style="width: 15.0691%; height: 36.9231px; text-align: center;">FY24</td> <td style="width: 15.0691%; height: 36.9231px; text-align: center;">FY23</td> <td style="width: 15.0691%; height: 36.9231px; text-align: center;">FY22</td> </tr> <tr style="height: 18.4615px;"> <td style="width: 32.1064%; height: 18.4615px; text-align: center;">Karnataka</td> <td style="width: 18.0238%; height: 18.4615px; text-align: center;">55.15%</td> <td style="width: 15.0691%; height: 18.4615px; text-align: center;">50.31%</td> <td style="width: 15.0691%; height: 18.4615px; text-align: center;">55.08%</td> <td style="width: 15.0691%; height: 18.4615px; text-align: center;">50.86%</td> </tr> <tr style="height: 36.9231px;"> <td style="width: 32.1064%; height: 36.9231px; text-align: center;">Andhra Pradesh</td> <td style="width: 18.0238%; height: 36.9231px; text-align: center;">10.34%</td> <td style="width: 15.0691%; height: 36.9231px; text-align: center;">12.81%</td> <td style="width: 15.0691%; height: 36.9231px; text-align: center;">10.06%</td> <td style="width: 15.0691%; height: 36.9231px; text-align: center;">8.35%</td> </tr> <tr style="height: 18.4615px;"> <td style="width: 32.1064%; height: 18.4615px; text-align: center;">Tamil Nadu</td> <td style="width: 18.0238%; height: 18.4615px; text-align: center;">4.84%</td> <td style="width: 15.0691%; height: 18.4615px; text-align: center;">7.24%</td> <td style="width: 15.0691%; height: 18.4615px; text-align: center;">10.02%</td> <td style="width: 15.0691%; height: 18.4615px; text-align: center;">9.97%</td> </tr> <tr style="height: 18.4615px;"> <td style="width: 32.1064%; height: 18.4615px; text-align: center;">Maharashtra</td> <td style="width: 18.0238%; height: 18.4615px; text-align: center;">7.61%</td> <td style="width: 15.0691%; height: 18.4615px; text-align: center;">6.50%</td> <td style="width: 15.0691%; height: 18.4615px; text-align: center;">4.71%</td> <td style="width: 15.0691%; height: 18.4615px; text-align: center;">6.85%</td> </tr> <tr style="height: 18.4615px;"> <td style="width: 32.1064%; height: 18.4615px; text-align: center;">Telangana</td> <td style="width: 18.0238%; height: 18.4615px; text-align: center;">6.65%</td> <td style="width: 15.0691%; height: 18.4615px; text-align: center;">6.13%</td> <td style="width: 15.0691%; height: 18.4615px; text-align: center;">9.16%</td> <td style="width: 15.0691%; height: 18.4615px; text-align: center;">10.24%</td> </tr> <tr style="height: 18.4615px;"> <td style="width: 32.1064%; height: 18.4615px; text-align: center;">Others</td> <td style="width: 18.0238%; height: 18.4615px; text-align: center;">15.41%</td> <td style="width: 15.0691%; height: 18.4615px; text-align: center;">17.01%</td> <td style="width: 15.0691%; height: 18.4615px; text-align: center;">10.98%</td> <td style="width: 15.0691%; height: 18.4615px; text-align: center;">13.73%</td> </tr> </tbody> </table> <ul data-spread="false"> <li> <p><strong>Backward Integration:</strong> Iron ore → Sponge Iron → MS Billets → TMT Bars, Coils, Pipes</p> </li> <li> <p><strong>Subsidiary:</strong> Vanya Steels Private Limited (Sponge iron production at Koppal)</p> </li> <li> <p><strong>Logistics:</strong> Access to ports (Emore, Mangalore, Mormugao) and railway siding under development at Koppal</p> </li> </ul> <h3><strong>D) Distribution Network Growth</strong></h3> <table> <tbody> <tr> <td style="text-align: center;">Particulars</td> <td style="text-align: center;">3M FY25</td> <td style="text-align: center;">FY24</td> <td style="text-align: center;">FY23</td> <td style="text-align: center;">FY22</td> </tr> <tr> <td style="text-align: center;">Distributors</td> <td style="text-align: center;">82</td> <td style="text-align: center;">87</td> <td style="text-align: center;">68</td> <td style="text-align: center;">36</td> </tr> <tr> <td style="text-align: center;">Direct Retail Channels</td> <td style="text-align: center;">748</td> <td style="text-align: center;">1,222</td> <td style="text-align: center;">907</td> <td style="text-align: center;">886</td> </tr> <tr> <td style="text-align: center;">Institutional Customers</td> <td style="text-align: center;">36</td> <td style="text-align: center;">45</td> <td style="text-align: center;">36</td> <td style="text-align: center;">34</td> </tr> </tbody> </table> <ul data-spread="false"> <li> <p><strong>Retail Network:</strong> 1,222+ direct sales points (as of June 2024)</p> </li> <li> <p><strong>Distributors:</strong> 82</p> </li> <li> <p><strong>Institutional Clients:</strong> 35+ (Notables: Sobha Ltd., NCC, Amara Raja Infra, Zetwerk, Casa Grande)</p> </li> <li> <p><strong>Key Markets:</strong> Karnataka, Andhra Pradesh, Telangana, Tamil Nadu, Maharashtra</p> </li> </ul> <h3>E) Financial Performance Highlights </h3> <table style="width: 49.9592%;"> <tbody> <tr> <td style="text-align: center; width: 36.6756%;"><strong>Particulars ( in cr )</strong></td> <td style="text-align: center; width: 15.9249%;"><strong>3M FY25</strong></td> <td style="text-align: center; width: 15.9249%;"><strong>FY24</strong></td> <td style="text-align: center; width: 15.9249%;"><strong>FY23</strong></td> <td style="text-align: center; width: 15.9249%;"><strong>FY22</strong></td> </tr> <tr> <td style="text-align: center; width: 36.6756%;">Revenue (from ops)</td> <td style="text-align: center; width: 15.9249%;">954</td> <td style="text-align: center; width: 15.9249%;">3,834</td> <td style="text-align: center; width: 15.9249%;">3,163</td> <td style="text-align: center; width: 15.9249%;">2,756</td> </tr> <tr> <td style="text-align: center; width: 36.6756%;">EBITDA</td> <td style="text-align: center; width: 15.9249%;">63</td> <td style="text-align: center; width: 15.9249%;">198</td> <td style="text-align: center; width: 15.9249%;">238</td> <td style="text-align: center; width: 15.9249%;">184</td> </tr> <tr> <td style="text-align: center; width: 36.6756%;">EBITDA Margin (%)</td> <td style="text-align: center; width: 15.9249%;">6.69%</td> <td style="text-align: center; width: 15.9249%;">5.18%</td> <td style="text-align: center; width: 15.9249%;">7.53%</td> <td style="text-align: center; width: 15.9249%;">6.68%</td> </tr> <tr> <td style="text-align: center; width: 36.6756%;">PAT</td> <td style="text-align: center; width: 15.9249%;">16</td> <td style="text-align: center; width: 15.9249%;">38</td> <td style="text-align: center; width: 15.9249%;">97</td> <td style="text-align: center; width: 15.9249%;">100</td> </tr> <tr> <td style="text-align: center; width: 36.6756%;">PAT Margin (%)</td> <td style="text-align: center; width: 15.9249%;">1.70%</td> <td style="text-align: center; width: 15.9249%;">1.01%</td> <td style="text-align: center; width: 15.9249%;">3.09%</td> <td style="text-align: center; width: 15.9249%;">3.65%</td> </tr> <tr> <td style="text-align: center; width: 36.6756%;">Operating Cash Flow</td> <td style="text-align: center; width: 15.9249%;">-96.56</td> <td style="text-align: center; width: 15.9249%;">325.40</td> <td style="text-align: center; width: 15.9249%;">-319.50</td> <td style="text-align: center; width: 15.9249%;">-51.93</td> </tr> <tr> <td style="text-align: center; width: 36.6756%;">Net Debt</td> <td style="text-align: center; width: 15.9249%;">1,026</td> <td style="text-align: center; width: 15.9249%;">992</td> <td style="text-align: center; width: 15.9249%;">1,054</td> <td style="text-align: center; width: 15.9249%;">418</td> </tr> <tr> <td style="text-align: center; width: 36.6756%;">Debt Equity Ratio</td> <td style="text-align: center; width: 15.9249%;">1.76</td> <td style="text-align: center; width: 15.9249%;">2.34</td> <td style="text-align: center; width: 15.9249%;">2.96</td> <td style="text-align: center; width: 15.9249%;">1.62</td> </tr> <tr> <td style="text-align: center; width: 36.6756%;">ROCE (%)</td> <td style="text-align: center; width: 15.9249%;">2.97</td> <td style="text-align: center; width: 15.9249%;">10.45</td> <td style="text-align: center; width: 15.9249%;">13.64</td> <td style="text-align: center; width: 15.9249%;">22.23</td> </tr> <tr> <td style="text-align: center; width: 36.6756%;">ROE (%)</td> <td style="text-align: center; width: 15.9249%;">3.03</td> <td style="text-align: center; width: 15.9249%;">9.42</td> <td style="text-align: center; width: 15.9249%;">29.42</td> <td style="text-align: center; width: 15.9249%;">47.89</td> </tr> </tbody> </table> <h3><strong>F) Peer Comparison</strong></h3> <table> <tbody> <tr> <td style="text-align: center;">Companies</td> <td style="text-align: center;"><strong>Revenue (in cr)</strong></td> <td style="text-align: center;"><strong>EBITDA Margins</strong></td> <td style="text-align: center;"><strong>PAT Margins</strong></td> <td style="text-align: center;"><strong>ROCE</strong></td> <td style="text-align: center;"><strong>D/E Ratio</strong></td> <td style="text-align: center;"><strong>MCap (in cr)</strong></td> <td style="text-align: center;"><strong>P/E</strong></td> </tr> <tr> <td style="text-align: center;">A-One Steels India Limited(FY24)</td> <td style="text-align: center;">3,834.21</td> <td style="text-align: center;">5.18%</td> <td style="text-align: center;">1.01%</td> <td style="text-align: center;">10.45</td> <td style="text-align: center;">2.34</td> <td style="text-align: center;">2636</td> <td style="text-align: center;">67.75</td> </tr> <tr> <td style="text-align: center;">Jai Balaji Industries Ltd.(FY25)</td> <td style="text-align: center;">6351</td> <td style="text-align: center;">~13.6%</td> <td style="text-align: center;">8.78%</td> <td style="text-align: center;">36.10%</td> <td style="text-align: center;">0.26</td> <td style="text-align: center;">10,336</td> <td style="text-align: center;">18.6</td> </tr> <tr> <td style="text-align: center;">Shyam Metallics and Energy Ltd(FY25)</td> <td style="text-align: center;">15945</td> <td style="text-align: center;">12.30%</td> <td style="text-align: center;">6%</td> <td style="text-align: center;">12%</td> <td style="text-align: center;">0.07</td> <td style="text-align: center;">27342</td> <td style="text-align: center;">29.7</td> </tr> <tr> <td style="text-align: center;">MSP Steel and Power Limited(FY25)</td> <td style="text-align: center;">2844</td> <td style="text-align: center;">4.61%</td> <td style="text-align: center;">-0.98%</td> <td style="text-align: center;">6.23%</td> <td style="text-align: center;">0.27</td> <td style="text-align: center;">1974</td> <td style="text-align: center;">in loss</td> </tr> </tbody> </table> <h3><strong>G) IPO Details</strong></h3> <ul data-spread="false"> <li> <p><strong>DRHP Filed:</strong> December 30, 2024</p> </li> <li> <p><strong>IPO Size:</strong> ₹650 crore (Fresh Issue: ₹600 crore + OFS: ₹50 crore)</p> </li> <li> <p><strong>Proposed Listing:</strong> BSE & NSE</p> </li> <li> <p>Objects of the Offer</p> </li> </ul> <table> <tbody> <tr> <td style="text-align: center;"><strong>Particulars</strong></td> <td style="text-align: center;"><strong>Amount (₹ Cr)</strong></td> </tr> <tr> <td style="text-align: center;">Expansion of Koppal facility via Vanya Steels Private Limited</td> <td style="text-align: center;">344.37</td> </tr> <tr> <td style="text-align: center;">Investment in solar power via Group Captive Companies</td> <td style="text-align: center;">40</td> </tr> <tr> <td style="text-align: center;">Pre-payment / repayment of borrowings</td> <td style="text-align: center;">100</td> </tr> <tr> <td style="text-align: center;">General Corporate Purposes</td> <td style="text-align: center;">-</td> </tr> </tbody> </table> <p><strong><br />Conclusion</strong> With its deep-rooted backward integration, expanding distribution network, and strong regional market presence, A One Steels India Limited is positioning itself as a rising force in India's steel sector. The upcoming IPO provides an opportunity for investors to tap into the growing infrastructure and steel demand in Southern India.</p> <p><strong>Disclaimer:</strong> UnlistedZone is not a SEBI-registered Research Analyst or Investment Advisor. All information shared on our platform—including articles, posts, investment insights, and price trends—is solely for educational and informational purposes. We do not provide any buy/sell recommendations or financial advice. Investors are advised to do their own due diligence or consult a SEBI-registered advisor before making any investment decisions. Investments in unlisted and pre-IPO shares are subject to market risks, including liquidity risk.</p>
<h2>About the Company:</h2> <p>A One Steels India Limited (ASIPL), established in Southern India, is a backward-integrated steel manufacturer with six plants across Karnataka and Andhra Pradesh. The company produces a wide range of steel products including TMT bars, pipes, coils, and sponge iron. ASIPL also utilizes 84–87% renewable energy in its operations and boasts a robust network of over 1,200 retail outlets. The company is now heading towards a ₹650 crore IPO (₹600 crore fresh issue + ₹50 crore OFS), aiming to fund expansion, green energy initiatives, and debt reduction. The increasing reliance on clean energy and regional dominance in Southern India positions ASIPL as a key player to watch in the mid-tier steel segment.</p> <h2>1. Total Shares Outstanding (Latest)</h2> <p>As per latest disclosures: <strong>6,84,67,532 equity shares</strong><br />(Source: DRHP)</p> <h2>2. Current Market Price (Unlisted)</h2> <p><strong>₹385 per share</strong> (as per unlisted market rates)</p> <h2>3. Estimated Current Valuation</h2> <p><strong>Valuation = Total Shares × Price per Share</strong><br />= 6,84,67,532 × ₹385<br />= <strong>₹2,636 crore</strong></p> <h2>A) FY24 Financial Performance</h2> <ul data-spread="false"> <li> <p><strong>Revenue</strong>: ₹3,834 Cr</p> </li> <li> <p><strong>PAT</strong>: ₹38 Cr</p> </li> <li> <p><strong>Implied P/E Ratio</strong>: ₹2,636 Cr ÷ ₹38.91 Cr = <strong>~67.75x</strong></p> </li> <li> <p><strong>EBITDA Margin</strong>: 5.18%</p> </li> <li> <p><strong>PAT Margin</strong>: 1.01%</p> </li> <li> <p><strong>ROCE</strong>: 10.45%</p> </li> <li> <p><strong>ROE</strong>: 9.42%</p> </li> <li> <p><strong>Debt-to-Equity Ratio</strong>: 2.34</p> </li> </ul> <h2>B) FY25 Projections (Based on 3M FY25 Annualized)</h2> <ul data-spread="false"> <li> <p><strong>Revenue (Annualized)</strong>: <strong>₹3,818 Cr</strong></p> </li> <li> <p><strong>PAT (Annualized)</strong>: <strong>₹64 Cr</strong></p> </li> <li> <p><strong>Forward P/E Ratio</strong>: <strong>~40.73x</strong></p> </li> </ul> <h2>C) Valuation Growth Snapshot</h2> <table> <tbody> <tr> <th style="text-align: center;"><strong>Date</strong></th> <th style="text-align: center;"><strong>Type</strong></th> <th style="text-align: center;"><strong>Amount Raised</strong></th> <th style="text-align: center;"><strong>Valuation</strong></th> <th style="text-align: center;"><strong>Implied Price/Share</strong></th> </tr> <tr> <td style="text-align: center;">Dec 2015</td> <td style="text-align: center;">Rights Issue</td> <td style="text-align: center;">₹2 crore</td> <td style="text-align: center;">₹9 crore</td> <td style="text-align: center;">₹100</td> </tr> <tr> <td style="text-align: center;">Mar 2021</td> <td style="text-align: center;">Rights Issue</td> <td style="text-align: center;">₹27.52 crore</td> <td style="text-align: center;">₹894 crore</td> <td style="text-align: center;">₹688</td> </tr> <tr> <td style="text-align: center;">Jun–Jul 2024</td> <td style="text-align: center;">Private Placement</td> <td style="text-align: center;">₹24.72 crore</td> <td style="text-align: center;">₹1,711 crore</td> <td style="text-align: center;">₹250.00</td> </tr> <tr> <td style="text-align: center;">Current (2025)</td> <td style="text-align: center;">Unlisted Market</td> <td style="text-align: center;">—</td> <td style="text-align: center;">₹2,636 crore</td> <td style="text-align: center;">₹385.00</td> </tr> </tbody> </table> <h2>Peer Comparison (FY24–25)</h2> <table> <tbody> <tr> <td style="text-align: center;"><strong>Company</strong></td> <td style="text-align: center;"><strong>Revenue (₹ Cr)</strong></td> <td style="text-align: center;"><strong>EBITDA Margin</strong></td> <td style="text-align: center;"><strong>PAT Margin</strong></td> <td style="text-align: center;"><strong>ROCE</strong></td> <td style="text-align: center;"><strong>D/E Ratio</strong></td> <td style="text-align: center;"><strong>Market Cap (₹ Cr)</strong></td> <td style="text-align: center;"><strong>P/E</strong></td> </tr> <tr> <td style="text-align: center;">A One Steels India Ltd (FY24)</td> <td style="text-align: center;">3,834</td> <td style="text-align: center;">5.18%</td> <td style="text-align: center;">1.01%</td> <td style="text-align: center;">10.45%</td> <td style="text-align: center;">2.34</td> <td style="text-align: center;">2,636</td> <td style="text-align: center;">67.75x</td> </tr> <tr> <td style="text-align: center;">Jai Balaji Industries (FY25)</td> <td style="text-align: center;">6,351</td> <td style="text-align: center;">~13.6%</td> <td style="text-align: center;">8.78%</td> <td style="text-align: center;">36.10%</td> <td style="text-align: center;">0.26</td> <td style="text-align: center;">10,336</td> <td style="text-align: center;">18.6x</td> </tr> <tr> <td style="text-align: center;">Shyam Metallics & Energy (FY25)</td> <td style="text-align: center;">15,945</td> <td style="text-align: center;">12.30%</td> <td style="text-align: center;">6.00%</td> <td style="text-align: center;">12.00%</td> <td style="text-align: center;">0.07</td> <td style="text-align: center;">27,342</td> <td style="text-align: center;">29.7x</td> </tr> <tr> <td style="text-align: center;">MSP Steel & Power (FY25)</td> <td style="text-align: center;">2,844</td> <td style="text-align: center;">4.61%</td> <td style="text-align: center;">-0.98%</td> <td style="text-align: center;">6.23%</td> <td style="text-align: center;">0.27</td> <td style="text-align: center;">1,974</td> <td style="text-align: center;">Loss</td> </tr> </tbody> </table> <h2>Conclusion</h2> <p>At ₹385 per share, <strong>A One Steels India Limited</strong> commands a valuation of <strong>₹2,636 crore</strong> in the unlisted market, which appears relatively high for a commodity-based business. The company is trading at a <strong>trailing P/E of ~67.75x</strong> based on FY24 earnings and a <strong>forward P/E of ~40.7x</strong> based on FY25 projections. While PAT margins remain thin, ASIPL’s consistent revenue traction, proactive adoption of renewable energy, and its regional dominance present a case for long-term potential. However, elevated leverage and premium valuation compared to listed peers warrant investor caution. With the upcoming IPO, investor interest will hinge on pricing and growth execution.</p> <blockquote> <p><strong>Disclaimer:</strong> UnlistedZone is not a SEBI-registered Research Analyst or Investment Advisor. All information shared is for educational and informational purposes only. Investors are advised to do their own due diligence or consult a SEBI-registered advisor before making any investment decisions.</p> </blockquote>
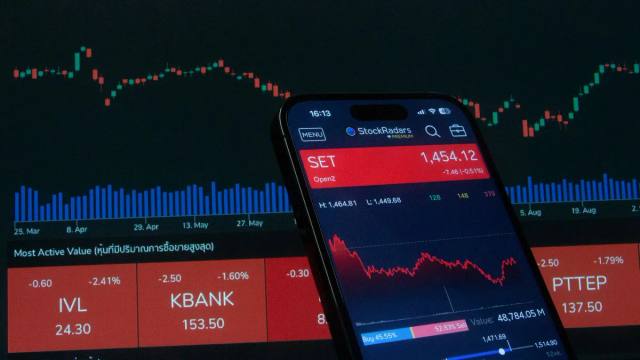
<p>Lenskart is all set for its IPO! 📈 Shareholder approval ✅, Public Ltd conversion ✅, and strong FY24 growth 🚀. With an IPO size of ₹8,500 crore ($1B+), DRHP filing is next. Will you invest in the Lenskart IPO?</p>


<h2>A) Overview</h2> <p><strong>Navi Technologies</strong>, the fintech unicorn founded by <strong>Flipkart co-founder Sachin Bansal</strong>, has successfully raised <strong>Rs 170 crore (~$20 million)</strong> through a debt funding round. This strategic capital infusion, led by <strong>PhillipCapital</strong>, aims to fuel Navi’s expansion in the financial services space—particularly in lending and digital payments.</p> <div><hr /></div> <h2>B) Key Investors & Deal Structure</h2> <p>As per regulatory filings accessed from the <strong>Registrar of Companies (RoC)</strong>, Navi Finserv issued <strong>1,700 Non-Convertible Debentures (NCDs)</strong> at a face value of <strong>Rs 10 lakh each</strong>. Here's how the round shaped up:</p> <ul data-spread="false"> <li> <p><strong>PhillipCapital</strong> – Rs 120 crore (1,200 NCDs)</p> </li> <li> <p><strong>NDX Finserve</strong> – Rs 10 crore</p> </li> <li> <p><strong>Arpee Group</strong> – Rs 10 crore</p> </li> <li> <p><strong>Ambit Finvest</strong> – Rs 10 crore</p> </li> <li> <p><strong>Grey Grass India Pvt Ltd</strong> – Rs 10 crore</p> </li> <li> <p><strong>Siddharth Colorchem, Ravi Dyewear, and Nahar Capital</strong> – Rs 10 crore collectively</p> </li> </ul> <div><hr /></div> <h2>C) Who is Navi Technologies?</h2> <p>Founded in <strong>2018</strong> by <strong>Sachin Bansal</strong> and <strong>Ankit Agarwal</strong>, Navi is a technology-first financial services platform catering to India’s growing digital-savvy population. Navi’s integrated offerings include:</p> <ul data-spread="false"> <li> <p><strong>Personal and Home Loans</strong> – via Navi Finserv (RBI-registered NBFC)</p> </li> <li> <p><strong>Mutual Funds & Health Insurance</strong> – through Navi’s in-house digital platforms</p> </li> <li> <p><strong>Navi UPI</strong> – A fast-growing digital payments solution</p> </li> </ul> <p>Its mission? To <strong>simplify financial products</strong> for the average Indian through an intuitive and paperless digital experience.</p> <div><hr /></div> <h2>D) Leadership Shake-Up in 2025</h2> <p>Earlier this year, Navi underwent a top-deck restructuring:</p> <ul data-spread="false"> <li> <p><strong>Sachin Bansal</strong> moved to the role of <strong>Executive Chairman</strong></p> </li> <li> <p><strong>Rajiv Naresh</strong> was appointed <strong>CEO of Navi Technologies</strong></p> </li> <li> <p><strong>Abhishek Dwivedi</strong> became <strong>CEO of Navi Finserv</strong></p> </li> </ul> <p>This transition signals Navi’s ambition to sharpen its execution and leadership depth for long-term scaling.</p> <div><hr /></div> <h2>E) Navi’s Rock-Solid FY24 Performance</h2> <p>Navi delivered standout financials in FY24:</p> <ul data-spread="false"> <li> <p><strong>Revenue from Operations</strong>: Rs <strong>2,290 crore</strong> (up <strong>37%</strong> from Rs 1,667 crore in FY23)</p> </li> <li> <p><strong>Net Profit</strong>: Rs <strong>358.5 crore</strong> (a <strong>17X jump</strong> YoY)</p> </li> </ul> <p>These figures showcase the company’s <strong>robust monetization</strong> across lending and UPI-driven products.</p> <div><hr /></div> <h2>F) Dominating the UPI Battlefield</h2> <p>Navi has emerged as a serious contender in the Indian UPI ecosystem. As of <strong>June 2025</strong>:</p> <ul data-spread="false"> <li> <p><strong>406 million UPI transactions</strong> processed</p> </li> <li> <p><strong>Transaction Value</strong>: Rs <strong>21,815 crore</strong></p> </li> <li> <p><strong>Rank</strong>: 4th largest UPI app in India by volume</p> </li> </ul> <p>This reflects strong traction and consumer trust in Navi’s payment ecosystem.</p> <div><hr /></div> <h2>G) Navigating Regulations & Capital Strategy</h2> <p>Despite a <strong>regulatory pause</strong> in 2023 by the <strong>RBI</strong> due to supervisory concerns, Navi implemented corrective actions swiftly and resumed operations.</p> <ul data-spread="false"> <li> <p>Raised <strong>Rs 950 crore</strong> via NCDs in 2023</p> </li> <li> <p>Announced plans in <strong>Feb 2025</strong> to raise <strong>Rs 600 crore</strong> more via similar instruments</p> </li> <li> <p>Shows a <strong>clear pattern</strong> of leveraging debt markets for growth while balancing regulatory compliance</p> </li> </ul> <div><hr /></div> <h2>H) Industry Analysis</h2> <p>India’s fintech industry continues to witness exponential growth, driven by digital adoption, UPI penetration, and favorable regulatory support. Key industry trends include:</p> <ul data-spread="true"> <li> <p><strong>Digital Lending Boom</strong>: NBFCs and digital-first lenders are experiencing increased demand, especially for personal and consumer loans. With smartphone penetration and low credit card usage, platforms like Navi are well-positioned to scale.</p> </li> <li> <p><strong>UPI Dominance</strong>: UPI has emerged as India’s preferred digital payment method, clocking over 10 billion transactions monthly. Navi's rank as the 4th largest UPI app puts it in the league of players like PhonePe, Google Pay, and Paytm.</p> </li> <li> <p><strong>Regulatory Oversight</strong>: The RBI has tightened its watch on digital lenders and NBFCs. However, companies like Navi that demonstrate strong compliance and governance structures stand to gain long-term trust.</p> </li> <li> <p><strong>Investment Momentum</strong>: Debt and equity capital continue to flow into high-performing fintechs. Navi’s ability to raise multiple debt rounds (Rs 950 crore in 2023 and Rs 170 crore in 2025) reflects investor confidence in its model.</p> </li> </ul> <p>As consumer credit demand surges and digital trust deepens, Navi stands as a key beneficiary of India’s fintech revolution.</p> <div><hr /></div> <h2>Final Takeaway</h2> <p>Navi Technologies' Rs 170 crore debt raise reaffirms its credibility and investor confidence in a highly competitive fintech environment. With solid financials, aggressive product scaling, and a visionary founder at the helm, Navi is poised to shape the <strong>next phase of India’s digital finance revolution</strong>.</p> <p> </p> <p><strong>Disclaimer:</strong> UnlistedZone is not a SEBI-registered Research Analyst or Investment Advisor. All information shared on our platform—including articles, posts, investment insights, and price trends—is solely for educational and informational purposes. We do not provide any buy/sell recommendations or financial advice. Investors are advised to do their own due diligence or consult a SEBI-registered advisor before making any investment decisions. Investments in unlisted and pre-IPO shares are subject to market risks, including liquidity risk and price volatility. UnlistedZone does not guarantee any returns and shall not be held liable for any losses incurred as a result of investment decisions taken based on the information provided.</p>
Indicative prices, company research and your enquiries — in your pocket. Get price notes on the names you follow and reach our team from anywhere.