Blogs, insights, guides and videos on India's unlisted market — all in one place.
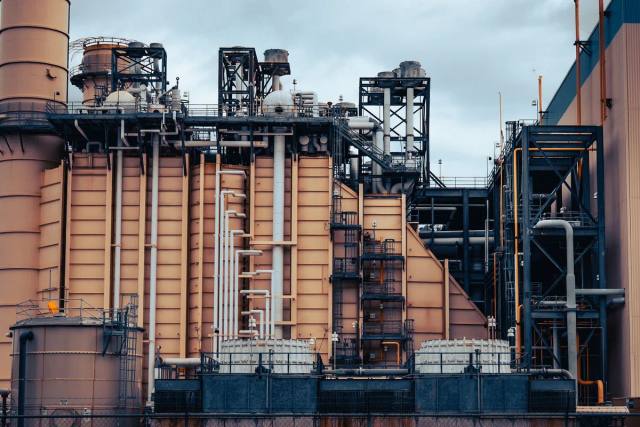
<h2>A) About the Company</h2> <p> Pace Digitek Infra Private Limited (formerly Pace Power Systems Private Limited)<br />Headquarterd in Bengaluru, India .Founded with expertise in power systems for telecom infrastructure, the company has evolved into an integrated infrastructure solutions provider with diversified verticals including telecom, energy, and EPC. The rebranding to <em>Pace Digitek Infra</em> reflects its expansion into large-scale infrastructure execution.</p> <h3>Business Model (Core Operations)</h3> <ul data-spread="false"> <li> <p><strong>Power Management Systems</strong>: Design, manufacture, installation, and maintenance for telecom infrastructure.</p> </li> <li> <p><strong>Optic Fiber Laying Solutions</strong>: Deployment of high-speed connectivity networks.</p> </li> <li> <p><strong>Renewable Energy Solutions</strong>: Implementation of sustainable energy and green infrastructure projects.</p> </li> </ul> <p><strong>Key Clients:</strong> Telecom operators and government agencies (rural electrification & digital infrastructure projects).</p> <h3>Industry Positioning</h3> <p>With India's strong infrastructure push (5G rollout, PM GatiShakti, green energy transition), Pace Digitek has positioned itself as a key EPC and infrastructure solutions player.</p> <h2>B) Key Highlights of the Year (FY2025)</h2> <ul data-spread="false"> <li> <p><strong>Revenue Growth:</strong> Jumped from ₹516 Cr (FY23) to ₹24,388 Cr (FY25), a 4626% increase in just two years.</p> </li> <li> <p><strong>EPC Pivot:</strong> 97.4% of FY25 revenue came from EPC projects, making it the dominant business segment.</p> </li> <li> <p><strong>Equity Infusion:</strong> Share capital increased from ₹5 Cr to ₹35.6 Cr in FY25.</p> </li> <li> <p><strong>Debt Reduction:</strong> Borrowings reduced by 67%, strengthening the balance sheet.</p> </li> <li> <p><strong>Cash Flow Stress:</strong> Despite profits, the company posted negative operating cash flow due to mounting receivables.</p> </li> </ul> <h2>C) Financial Performance (₹ Crore)</h2> <h3>Profit & Loss Snapshot</h3> <p><img src="https://unlistedzone.com/storage/knowledge-logo/app_image-1757916620.jpg" alt="" width="747" height="482" /></p> <p><strong>Revenue Mix (FY25):</strong></p> <ul data-spread="false"> <li> <p>EPC Projects – ₹2376Cr (97.4%)</p> </li> <li> <p>Services – ₹33.1 Cr (1.4%)</p> </li> <li> <p>Products – ₹29.4 Cr (1.2%)</p> </li> </ul> <h3>Cash Flow Analysis</h3> <p><img src="https://unlistedzone.com/storage/knowledge-logo/app_image-1757916645.jpg" alt="" width="720" height="434" /></p> <blockquote> <p><strong>Insight:</strong> Negative operating cash flow in FY25 is a critical concern, driven by receivable buildup.</p> </blockquote> <h2>Balance Sheet Strength</h2> <p><img src="https://unlistedzone.com/storage/knowledge-logo/app_image-1757916673.jpg" alt="" width="768" height="442" /></p> <p><strong>Key Ratios:</strong></p> <ul data-spread="false"> <li> <p>Current Ratio: 1.53 (vs. 1.14 in FY24) → Improved liquidity but low-quality assets.</p> </li> <li> <p>Debt-Equity: 0.14 (vs. 1.24) → Low leverage, stronger balance sheet.</p> </li> <li> <p>ROE: 34% (down from 56%) → Diluted post-equity infusion.</p> </li> <li> <p>Trade Receivables Days: 170 (worsened, slower collections).</p> </li> </ul> <h2>Segment/Division-Wise Analysis</h2> <ul data-spread="false"> <li> <p><strong>EPC Projects:</strong> Core revenue driver, ₹2376Cr contribution.</p> </li> <li> <p><strong>Products & Services:</strong> ₹62.6 Cr combined; minimal contribution.</p> </li> </ul> <h2>E) Management Discussion & Analysis</h2> <h3>Opportunities</h3> <ul data-spread="false"> <li> <p>Government infra push (PM GatiShakti, NIP).</p> </li> <li> <p>Rural electrification and digital connectivity.</p> </li> <li> <p>Renewable energy transition.</p> </li> </ul> <h3>Challenges</h3> <ul data-spread="false"> <li> <p><strong>Liquidity Crisis:</strong> Working capital cycle heavily stretched.</p> </li> <li> <p><strong>Competition:</strong> Intense margin pressures in EPC space.</p> </li> <li> <p><strong>Execution Risk:</strong> Project delays may erode profitability.</p> </li> </ul> <h3>Strategic Roadmap</h3> <ul data-spread="false"> <li> <p>Strengthen receivable collection process.</p> </li> <li> <p>Explore invoice discounting for cash flow.</p> </li> <li> <p>Maintain EPC leadership while expanding renewable projects.</p> </li> </ul> <h2>F) Product Control Portfolio</h2> <p><strong>Hybrid DC Power System, DC Power System, Charge Control Unit (CCU), Lithium Battery, AMF, LT Panel / Meter panel, DG, Outdoor IP-55 Cabinet, Remote Monitoring System (RMS), Inverter, SMPS</strong></p> <h2>Service Offerings</h2> <ol start="1" data-spread="false"> <li> <p><strong>Power Management Systems</strong> – Reliable power infrastructure solutions.</p> </li> <li> <p><strong>Optic Fiber Laying</strong> – High-speed digital connectivity solutions.</p> </li> <li> <p><strong>Renewable Energy Solutions</strong> – Clean energy-driven infrastructure.</p> </li> </ol> <h2>G) Valuation Insights (Unlisted Market)</h2> <ul data-spread="false"> <li> <p>Current unlisted share price: <em>225</em></p> </li> <li> <p>Market Cap : 4015 Cr</p> </li> <li> <p>Ratios: P/E - 14.39 ; P/B - 3.32</p> <p><br /><strong>Future Outlook</strong></p> </li> </ul> <ul data-spread="false"> <li> <p><strong>Positive Tailwinds:</strong> Infrastructure push, renewable adoption.</p> </li> <li> <p><strong>Critical Fix Needed:</strong> Working capital management.</p> </li> <li> <p><strong>Long-Term Growth:</strong> Strong potential to become a market leader if liquidity is stabilized.</p> </li> </ul> <h2>H) SWOT Analysis of Pace Digitiek Unlisted Shares</h2> <p><strong>Strengths:</strong></p> <ul data-spread="false"> <li> <p>Diversified Revenue Model (Products, EPC, O&M).</p> </li> <li> <p>Strong Order Book & Astronomical Revenue Growth.</p> </li> <li> <p>Robust Balance Sheet with Low Debt and High Reserves.</p> </li> <li> <p>Niche Expertise in high-demand sectors (Telecom, Power, Renewable Energy).</p> </li> </ul> <p><strong>Weaknesses:</strong></p> <ul data-spread="false"> <li> <p>Severe Working Capital Management Issues.</p> </li> <li> <p>Negative Operating Cash Flow.</p> </li> <li> <p>High Customer Concentration Risk.</p> </li> </ul> <p><strong>Opportunities:</strong></p> <ul data-spread="false"> <li> <p>Government Initiatives (Infra Pipeline, 5G, Green Energy).</p> </li> <li> <p>Proven Scalability for Large Contracts.</p> </li> <li> <p>Expansion in Rural Electrification & Connectivity.</p> </li> </ul> <p><strong>Threats:</strong></p> <ul data-spread="false"> <li> <p>Intense Competition in the EPC Sector.</p> </li> <li> <p>Execution & Project Delay Risks.</p> </li> <li> <p>Potential Liquidity Crisis.</p> </li> </ul> <h3>UnlistedZone View</h3> <p><strong>Investment Thesis:</strong> Pace Digitek is an infrastructure growth story with explosive revenue scale-up and a strong balance sheet post-equity infusion. Its EPC dominance ensures future contracts, especially under India’s infrastructure boom.</p> <p><strong>Risks:</strong> Severe working capital issues may lead to solvency risks if not addressed immediately.</p> <p><strong>Suitability:</strong> Suitable for HNIs and long-term investors with a high-risk appetite. Short-term liquidity constraints may weigh on performance.<br /><br /><strong>CONCLUSION</strong><br />Pace Digitek Infra has undergone a transformative phase from FY2023 to FY2025, evolving into a significant entity in the infrastructure space. This transformation is marked by <strong>explosive revenue growth</strong> (from ₹516 Cr to ₹24,387 Cr), a <strong>strengthened balance sheet</strong> through a substantial equity infusion, and <strong>improved profitability</strong>. However, this rapid growth has introduced a significant challenge: <strong>severe working capital strain</strong> evidenced by soaring receivables and negative operating cash flow in FY2025. The company's strategic focus on large-scale EPC projects has been the key driver of this growth.</p> <p><strong>Disclaimer:</strong> <br />UnlistedZone is not a SEBI-registered Research Analyst or Investment Advisor. All information provided on our platform is strictly for educational and informational purposes. We do not offer investment advice or stock recommendations. Investors are advised to conduct their own due diligence or consult a SEBI-registered advisor. Investments in unlisted and pre-IPO shares are subject to market risks including illiquidity and volatility. UnlistedZone does not assure any returns or accept liability for investment outcomes based on this report.</p>

<p>In the fast-paced world of Indian logistics, few names command as much respect as <strong>Skyways Air Services Limited (SASL)</strong>. From its humble beginnings as a Custom House Agent in 1984, Skyways has taken flight to become a multimodal logistics powerhouse. Now, with its highly anticipated Initial Public Offering (IPO), the company is poised to redefine its journey and offer investors a chance to be part of its next growth chapter.</p> <h2>A) From Custom House Agent to Cargo King: The Skyways Evolution</h2> <p>Headquartered in New Delhi, Skyways’ story is one of <strong>strategic evolution</strong>. Over four decades, the company has meticulously built an integrated, tech-enabled logistics ecosystem. Under its umbrella, a family of <strong>homegrown brands</strong> has flourished:</p> <ul data-spread="false"> <li> <p><strong>Skyways Air Services (1983)</strong> – The flagship and the foundation of its market dominance.</p> </li> <li> <p><strong>Forin Container Line (2004)</strong> – Expanding its reach into ocean freight.</p> </li> <li> <p><strong>Phantom Road Express (2018)</strong> – Strengthening its domestic trucking network.</p> </li> <li> <p><strong>sKart Global Express (2019)</strong> – Entering the competitive express delivery space.</p> </li> <li> <p><strong>SLS Logistik Academy (2019)</strong> – Investing in the future by building logistics talent.</p> </li> </ul> <p>This diversification allows Skyways to be a <strong>one-stop logistics partner</strong> for over 7,600 clients across FMCG, pharma, automotive, and textiles.</p> <h2>B) Unmatched Leadership in the Skies</h2> <p>Skyways isn’t just a participant in the air freight market; it <strong>leads it</strong>.</p> <ul data-spread="false"> <li> <p>Ranked <strong>India’s No. 1 Air Freight Forwarder (2022–2024)</strong> by <em>World ACD</em> for air export volumes.</p> </li> <li> <p>Winner of the <strong>Regional Airfreight Forwarder of the Year</strong> at the <em>World Air Cargo Awards 2025</em>.</p> </li> </ul> <p>The data confirms this dominance: in <strong>FY24</strong>, the company handled over <strong>40,000 MT of cargo</strong>. By <strong>FY25</strong>, volumes rose further, cementing its leadership over global giants like DHL and DB Schenker in the Indian market.</p> <h2>C) Financial Performance: Growth at Full Throttle (₹ Crore) of Skyways Air Services Unlisted Shares</h2> <p><strong>Profit & Loss Statement</strong></p> <p><strong><img src="https://unlistedzone.com/storage/knowledge-logo/app_image-1757933638.jpg" alt="" width="639" height="390" /></strong></p> <p>The <strong>strong revenue recovery in FY25 (₹2,248 Cr)</strong> indicates successful business expansion and market capture. However, the <strong>slight compression in Net Profit Margin (NPM)</strong> from 2.64% to 2.14% suggests that costs (likely interest on debt and operational expenses) grew faster than revenue this year, a common occurrence in high-growth phases. The rebound in EBITDA and PAT absolutes confirms that the core business remains fundamentally profitable.</p> <h3>Revenue Mix </h3> <p><img src="https://unlistedzone.com/storage/knowledge-logo/app_image-1757933671.jpg" alt="" width="605" height="348" /></p> <h3>Geographical Revenue Mix ( In Cr ) </h3> <p><img src="https://unlistedzone.com/storage/knowledge-logo/app_image-1757933788.jpg" alt="" width="630" height="293" /></p> <ul data-spread="false"> <li> <p><strong>By Service:</strong> This breakdown highlights the company's core focus, with <strong>Integrated Logistics Solutions</strong> constituting over 99% of total revenue. The minimal revenue from other segments like IT and Tech Solutions shows they are likely ancillary services supporting the main logistics business rather than standalone revenue drivers.</p> </li> <li> <p><strong>By Geography:</strong> The data reveals a significant strategic insight: <strong>international revenue more than doubled in FY25</strong> (from ₹259 Cr to ₹559 Cr). This explosive growth outside India is a major contributor to the overall topline increase and points to successful global expansion and a reduced reliance on the domestic market.</p> </li> </ul> <h3>Balance Sheet & Leverage ( In cr ) </h3> <p><img src="https://unlistedzone.com/storage/knowledge-logo/app_image-1757933763.jpg" alt="" width="616" height="316" /></p> <p>This snapshot of the company's financial health reveals an <strong>aggressive growth strategy</strong>. The near-tripling of assets in three years signals massive investment in capacity (like warehouses, vehicles, tech). This expansion has been primarily funded by debt, as seen in the <strong>sharp rise in borrowings to ₹558 Cr</strong>. The <strong>jump in Trade Receivables</strong> indicates that sales are being made on credit, which fuels growth but temporarily traps cash, leading to the working capital strain evident in the cash flow statement.</p> <h3><strong>Cash Flow Analysis</strong></h3> <p><strong><img src="https://unlistedzone.com/storage/knowledge-logo/app_image-1757933736.jpg" alt="" width="621" height="295" /></strong></p> <p>The Cash Flow statement tells the story of the company's growth strategy. <strong>Negative CFO in FY24 and a minimal positive in FY25</strong> is a classic sign of a capital-intensive business growing rapidly, as cash is spent on operations faster than it is collected. The consistently <strong>negative CFI</strong> confirms continuous investment in long-term assets. To bridge this gap, the company relies heavily on external financing (<strong>positive CFF</strong>), through both debt and equity (including the upcoming IPO).</p> <h3>D) Market Leadership & Client Summary of Skyways Air Services Unlisted Shares</h3> <p><strong>Market Dominance:</strong></p> <ul data-spread="false"> <li> <p><strong>Award:</strong> Recognized as India's No. 1 Air Freight Forwarder for 8 consecutive years (2017-2024).</p> </li> <li> <p><strong>Scale:</strong> Handled <strong>52,800 Air Waybills</strong> and <strong>40,371 MT</strong> of cargo in FY25.</p> </li> <li> <p><strong>Leadership:</strong> The nearest competitor managed only <strong>76%</strong> of Skyways' shipment volume.</p> </li> </ul> <p><strong>Diverse Client Base (7,600+ Clients):</strong><br />Skyways serves a vast portfolio of leading companies across key industries, including:</p> <ul data-spread="false"> <li> <p><strong>FMCG:</strong> ITC, Dabur, Patanjali</p> </li> <li> <p><strong>Pharmaceuticals:</strong> Cipla, Dr. Reddy's, Glenmark</p> </li> <li> <p><strong>Automotive:</strong> Tata Motors, Honda, Mahindra, TVS</p> </li> <li> <p><strong>Engineering:</strong> Larsen & Toubro, Honeywell, Samsung</p> </li> <li> <p><strong>Textile:</strong> Louis Vuitton, Arvind, Sainsbury's</p> </li> </ul> <p><strong>Competitive Landscape:</strong><br />Skyways leads the market in the number of shipments (AWBs), significantly outperforming all major global and domestic competitors like DHL, DB Schenker, and DSV.</p> <h3> E) IPO Details at a Glance of Skyways Air Services Unlisted Shares</h3> <p><img src="https://unlistedzone.com/storage/knowledge-logo/app_image-1757933526.jpg" alt="" width="614" height="442" /></p> <h2> F) Peer Comparison (as of Sept 2025) of Skyways Air Services Unlisted Shares</h2> <p><img src="https://unlistedzone.com/storage/knowledge-logo/app_image-1757934110.jpg" alt="" width="626" height="309" /></p> <h3>G) Unlisted Market Overview of Skyways Air Services Unlisted Shares</h3> <p><strong>Current Unlisted Price :</strong> ₹142 </p> <p><strong>Unlisted Market Cap :</strong> ₹ 1674 Cr</p> <p><strong>P/B Ratio:</strong> 4.16 </p> <p><strong>D/E Ratio</strong> : 1.42</p> <p><strong>ROE :</strong> 12.23</p> <p>This contextualizes Skyways' valuation and operational efficiency within the industry. The standout metric is <strong>Skyways' ROCE of 18.6%</strong>, which dwarfs its listed peers. This indicates that the company generates a much higher return on every rupee of capital invested, making it a more efficient operator. Furthermore, its <strong>P/E ratio of 34.8x</strong> is significantly more reasonable compared to Delhivery's 174x, suggesting that while the market values its growth, it is not as hyper-inflated as some competitors.</p> <h2>H) Strengths vs Risks in Skyways Air Services Unlisted Shares</h2> <p><strong>Strengths:</strong></p> <ul data-spread="false"> <li> <p>Undisputed market leadership in air freight.</p> </li> <li> <p>Diversified multimodal logistics model.</p> </li> <li> <p>Superior profitability with ROCE of 18.6%.</p> </li> <li> <p>Award-winning brand trusted by clients.</p> </li> </ul> <p><strong>Risks:</strong></p> <ul data-spread="false"> <li> <p>High leverage of ₹558 Cr, though IPO funds will reduce this.</p> </li> <li> <p>Working capital intensity with rising receivables.</p> </li> <li> <p>Margin pressure despite revenue growth.</p> </li> <li> <p>Execution risks due to rapid expansion.</p> </li> </ul> <h2>Disclaimer: </h2> <p>UnlistedZone is not a SEBI-registered Research Analyst or Investment Advisor. All information provided on our platform is strictly for educational and informational purposes. We do not offer investment advice or stock recommendations. Investors are advised to conduct their own due diligence or consult a SEBI-registered advisor. Investments in unlisted and pre-IPO shares are subject to market risks including illiquidity and volatility. UnlistedZone does not assure any returns or accept liability for investment outcomes based on this report.</p>
<h3>About the Company</h3> <p>Indofil Industries Limited, part of the <strong>K.K. Modi Group</strong>, traces its roots back to 1962 when it was established as a subsidiary of Rohm & Haas Co., USA, initially named Indofil Chemicals Limited. The first EBDC plant was commissioned in Thane in 1965. It became independent in 1982 under Mr. K.K. Modi as Modipon Ltd. and was reincorporated as Indofil Industries Limited in 1993. Headquartered in Mumbai, it is a <strong>research-led, fully integrated chemical company</strong> specializing in <strong>agrochemicals and specialty chemicals</strong>. With a mission to deliver innovative and sustainable solutions for crop care and industrial sectors, Indofil has grown into a diversified entity with a global presence in <strong>120+ countries</strong>.</p> <h3>Business Model & Divisions of Indofil Industries Unlisted Shares</h3> <p>Indofil’s business model revolves around the <strong>"Crop Care Concept"</strong>, identifying crop needs and delivering tailored solutions. Its operations focus on <strong>R&D-driven innovation</strong> with a mix of agrochemicals and specialty chemicals.</p> <p><strong>Divisions:</strong></p> <ul data-spread="false"> <li> <p><strong>Agrochemical Division</strong>: Offers insecticides, herbicides, fungicides, and plant nutrition solutions in India and abroad.</p> </li> <li> <p><strong>Xoritas Private Limited (Subsidiary)</strong>: Specializes in bio-stimulants, micronutrients, and plant growth regulators.</p> </li> <li> <p><strong>Indofil Innovative Solutions (IIS)</strong>: Provides solutions for plastics, paints, coatings, leather, textiles, and construction.</p> </li> </ul> <p>The company operates <strong>3 manufacturing units</strong>, with a total production volume of <strong>3,41,733 KL</strong>, supported by <strong>14 subsidiaries (including step-down)</strong>.</p> <h3>Industry Positioning of Indofil Industries Unlisted Shares</h3> <p>Indofil is a <strong>leading player in the Indian agrochemical market</strong>, particularly strong in fungicides like Mancozeb, with a robust global export network. Competing with peers like UPL and PI Industries, Indofil has positioned itself through:</p> <ul data-spread="false"> <li> <p><strong>Sustainability</strong>: 18% renewable energy, 100% water recycling, zero liquid discharge.</p> </li> <li> <p><strong>Innovation</strong>: 1 R&D office, 8 new launches, 6 patents filed, 2 patents granted.</p> </li> <li> <p><strong>Recognition</strong>: Export Excellence Award (Runner-Up, Large Scale) at ICSCE 2025 Dubai.</p> </li> </ul> <p>The global agrochemical industry is projected to grow at an <strong>8.6% CAGR</strong>, which offers a strong tailwind for the company.</p> <h3>Key Highlights of the Year FY2024-2025</h3> <ul data-spread="false"> <li> <p><strong>8 new products launched</strong>, <strong>6 patents filed</strong>, and <strong>2 patents granted</strong>.</p> </li> <li> <p><strong>18% volume growth</strong> with improved profitability despite marginal revenue growth.</p> </li> <li> <p><strong>Sustainability achievements</strong>: LCA study for Mancozeb, LTIFR of 0.</p> </li> <li> <p><strong>Expansion of international presence</strong> in emerging markets.</p> </li> <li> <p><strong>Recognition</strong> at ICSCE Dubai for export excellence.</p> </li> </ul> <h2>Financial Performance of Indofil Industries Unlisted Shares</h2> <h3><strong>Profit & Loss Statement (₹ in Crore)</strong></h3> <p><strong><img src="https://unlistedzone.com/storage/knowledge-logo/app_image-1757498012.jpg" alt="" width="681" height="439" /></strong></p> <p>The Profit & Loss statement reveals a company that has dramatically improved its efficiency and profitability over the last three years.</p> <ul data-spread="false"> <li> <p><strong>Top-Line Stability, Bottom-Line Explosion:</strong> While revenue grew a healthy <strong>9.5%</strong> from FY23 to FY25 (₹3,037 Cr to ₹3,325 Cr), the bottom-line growth is astounding. Profit After Tax (PAT) nearly <strong>doubled</strong>, surging by <strong>86.8%</strong> from ₹242 Cr in FY23 to ₹452 Cr in FY25.</p> </li> <li> <p><strong>Massive Margin Expansion:</strong> </p> <ul data-spread="false"> <li> <p><strong>Gross Profit Margin:</strong> Jumped from <strong>36.68%</strong> (FY23) to <strong>44.12%</strong> (FY25). This suggests much better control over the cost of raw materials, a favorable product mix (selling more high-margin products).</p> </li> <li> <p><strong>EBITDA Margin:</strong> Improved from <strong>12.51%</strong> to <strong>16.30%</strong>, showing enhanced operational efficiency.</p> </li> <li> <p><strong>PAT Margin:</strong> More than doubled from <strong>7.97%</strong> to <strong>13.59%</strong>. This means for every ₹100 of revenue, the company kept ₹13.59 as profit in FY25, compared to just ₹7.97 two years prior.</p> </li> </ul> </li> </ul> <h3><strong>Cash Flow Statement (₹ in Crore)</strong></h3> <p><strong><img src="https://unlistedzone.com/storage/knowledge-logo/app_image-1757498035.jpg" alt="" width="700" height="453" /></strong></p> <p>The Cash Flow Statement confirms the quality of the impressive earnings.</p> <ul data-spread="false"> <li> <p><strong>Strong Operational Cash Generation:</strong> After a dip in FY23, <strong>Cash Flow from Operations (CFO)</strong> rebounded powerfully to <strong>₹426 Cr</strong> in FY24. Although it decreased to <strong>₹232 Cr</strong> in FY25, this is still strong and positive. The difference between PAT (₹452 Cr) and CFO (₹232 Cr) in FY25 is primarily due to a significant increase in working capital</p> </li> <li> <p><strong>Prudent Investing and Financing:</strong> The company has been consistently investing in PPE (Capital Expenditure) to maintain and grow operations.</p> <h3><strong>Balance Sheet (₹ in Crore)</strong></h3> <strong><img src="https://unlistedzone.com/storage/knowledge-logo/app_image-1757498072.jpg" alt="" width="646" height="482" /></strong></li> </ul> <p>Total assets grew 55.2% YoY to ₹8,003 Cr in 2025, driven by investments surging to ₹4,768 Cr (from ₹2,333 Cr).</p> <p>Liabilities increased similarly, with equity at ₹3,498.73 Cr (down slightly due to reserves adjustment).</p> <p>Debt reduced to ₹237 Cr, yielding a low Debt/Equity ratio of 0.07.</p> <p>Net worth (equity) improved overall, with reserves at ₹3,476 Cr.</p> <p>Liquidity is strong, with cash at ₹434 Cr end-2025 and trade receivables up 22.8% to ₹1,109 Cr, supported by positive CFO.</p> <h3>Segment-Wise Analysis of Indofil Industries Unlisted Shares</h3> <ul data-spread="false"> <li> <p><strong>Agrochemicals (~89%)</strong>: Dominated by fungicides (esp. Mancozeb), insecticides, herbicides, and plant nutrition. Strong export orientation has supported volume growth.</p> </li> <li> <p><strong>Specialty Chemicals (~11%)</strong>: Serves industrial clients in plastics, coatings, textiles, and leather. This division enhances diversification and reduces reliance on agro segment.</p> </li> <li> <p><strong>Regional Performance</strong>: Solid growth in India, coupled with a robust presence in 120+ countries. Emerging markets remain a key focus for expansion.</p> </li> </ul> <h3>Management Discussion & Analysis on Indofil Industries Unlisted Shares</h3> <ul data-spread="false"> <li> <p><strong>Market Outlook</strong>: Rising global food demand and a growing agrochemical industry (CAGR 8.6%) position Indofil well for future growth.</p> </li> <li> <p><strong>Risks</strong>: Dependence on rainfall, raw material price fluctuations, intense competition, and global trade disruptions are key challenges.</p> </li> <li> <p><strong>Strategic Roadmap</strong>: Indofil aims to expand product registrations, strengthen R&D, and invest in capacity upgrades. Sustainability and efficiency remain core priorities.</p> </li> </ul> <h3>Shareholding Pattern of Indofil Industries Unlisted Shares</h3> <p><img src="https://unlistedzone.com/storage/knowledge-logo/app_image-1757498532.jpg" alt="" width="716" height="444" /></p> <p><strong>Discussion:</strong> The promoter group maintains strong control with 45.39% stake, while institutional presence through FII adds credibility. The diversified shareholding provides stability, but high promoter stake also ensures long-term commitment.</p> <h3>Valuation Insights of Indofil Industries Unlisted Shares</h3> <p><img src="https://unlistedzone.com/storage/knowledge-logo/app_image-1757498110.jpg" alt="" width="668" height="463" /></p> <p><strong>Discussion:</strong> Indofil trades at attractive valuation multiples, especially considering its large holdings in Godfrey Phillips India Ltd. (worth ~₹5,867 Cr). This makes the core agro and specialty chemicals business effectively undervalued. Its low leverage, high ROE, and consistent cash flows further strengthen its investment appeal.</p> <h3>Future Outlook</h3> <ul data-spread="false"> <li> <p><strong>Growth Opportunities</strong>: Product portfolio expansion, increased global penetration, and capacity upgrades.</p> </li> <li> <p><strong>Tailwinds</strong>: Rising food demand, favorable industry growth rate, sustainability focus.</p> </li> <li> <p><strong>Headwinds</strong>: Trade disruptions, rainfall volatility, and raw material dependency.</p> </li> </ul> <p><strong>Discussion:</strong> Indofil’s future lies in leveraging its R&D pipeline, scaling exports, and unlocking hidden asset value. While risks persist, its strong fundamentals and low debt provide resilience against cyclical downturns.</p> <h3>UnlistedZone View on Indofil Industries Unlisted Shares</h3> <p>Indofil is an undervalued gem in the unlisted market. Its Godfrey Phillips stake exceeds its own market cap, making its core business nearly free for investors. This hidden value, combined with robust agrochemical fundamentals, makes Indofil a rare opportunity.</p> <p><strong>Investment Thesis</strong>: Strong market positioning, undervaluation, sustainable business practices.</p> <p><strong>Risks: </strong>Liquidity constraints in unlisted markets, agro cyclicality, and external economic shocks.</p> <p><strong>Suitability:</strong> Best for HNIs and long-term investors seeking undervalued, asset-rich companies.</p> <p><strong>Conclusion:</strong> Indofil Industries combines innovation, sustainability, and hidden value creation. With solid financials, global presence, and undervaluation, it stands out as a compelling long-term bet in the unlisted market.<br /><br /></p> <p><strong>Disclaimer :</strong></p> <p>UnlistedZone is not a SEBI-registered Research Analyst or Investment Advisor. All information provided on our platform is strictly for educational and informational purposes. We do not offer investment advice or stock recommendations. Investors are advised to conduct their own due diligence or consult a SEBI-registered advisor. Investments in unlisted and pre-IPO shares are subject to market risks including illiquidity and volatility. UnlistedZone does not assure any returns or accept liability for investment outcomes based on this report.</p>
<h2>A) About the Company</h2> <p>Orbis Financial Corporation Limited (OFCL), established in 2005, is a <strong>SEBI-registered Custodian, Clearing Member, and Registrar & Transfer Agent (RTA)</strong>. The company plays a critical role in India’s financial ecosystem by providing backend infrastructure and transaction support to institutional investors.</p> <p>Its service verticals span across:</p> <ul data-spread="false"> <li> <p><strong>Custody & Fund Accounting</strong></p> </li> <li> <p><strong>Clearing (Equity, Commodity, Currency Derivatives)</strong></p> </li> <li> <p><strong>Registrar & Share Transfer Agent (RTA) Services</strong></p> </li> <li> <p><strong>Trusteeship</strong></p> </li> </ul> <p>Industry positioning: Orbis is among the few players in India with a <strong>comprehensive custodial license</strong>, enabling it to cater to <strong>FPIs, AIFs, PMS, DIIs, and Trading Members</strong>. Recently, it also expanded into <strong>GIFT City with IFSCA approval</strong>, positioning itself for global business.</p> <h2>B) Key Highlights of the Year (FY25) Orbis Financial Unlisted Shares</h2> <ul data-spread="false"> <li> <p><strong>Expansion into GIFT City</strong>: Approval from IFSCA marks its entry into global financial markets.</p> </li> <li> <p><strong>Scaling Institutional Base</strong>: Growing presence across FPIs, AIFs, and DIIs amid rising India-focused investments.</p> </li> <li> <p><strong>Technology-Led Operations</strong>: Strengthened digital platforms for custody, clearing, and fund accounting services.</p> </li> <li> <p><strong>Low-Profile Operator</strong>: Despite its quiet profile, Orbis is a vital enabler for institutional flows in Indian capital markets.</p> </li> </ul> <h2><strong>C) Orbis Financial Corporation: Key Highlights & Growth (FY24-FY25)</strong></h2> <p><strong><img src="https://unlistedzone.com/storage/knowledge-logo/app_image-1757486229.jpg" alt="" width="757" height="409" /></strong></p> <h3><strong>Other Operational Highlights (FY25)</strong></h3> <ul data-spread="false"> <li> <p><strong>Active Custody Clients:</strong> 4,800+</p> </li> <li> <p><strong>Total Employees:</strong> 192</p> </li> <li> <p><strong>Shareholder Base:</strong> 8,100</p> </li> </ul> <h2>D) Financial Performance (FY23–FY25) of Orbis Financial Unlisted Shares</h2> <h3>Revenue & Profitability of Orbis Financial Unlisted Shares</h3> <p><img src="https://unlistedzone.com/storage/knowledge-logo/app_image-1757486205.jpg" alt="" width="774" height="499" /></p> <ol start="1" data-spread="false"> <li> <p><strong>Revenue Growth</strong>:</p> <ul data-spread="false"> <li> <p>Orbis’s revenue grew from ₹297 Cr in FY23 to ₹556 Cr in FY25, reflecting a robust <strong>CAGR of ~37%</strong>. This growth is driven by:</p> <ul data-spread="false"> <li> <p>A 15.5% YoY increase in Assets Under Custody (AUC) to ₹1,42,569 Cr in FY25, indicating higher transaction volumes and client activity.</p> </li> <li> <p>A significant 65.3% YoY jump in <strong>Revenue from Services</strong> (₹227.35 Cr in FY25 vs. ₹137.57 Cr in FY24), showcasing strong demand for custody, clearing, and RTA services.</p> </li> <li> <p>A 14.7% YoY increase in <strong>Treasury Income</strong> (₹328.81 Cr in FY25), which likely benefits from managing client funds and margin flows in a high-interest-rate environment.</p> </li> </ul> </li> <li> <p>The growth aligns with Orbis’s expansion into GIFT City and increasing institutional participation (FPIs, AIFs, DIIs) in India’s capital markets.</p> </li> </ul> </li> <li> <p><strong>Profitability and Margins</strong>:</p> <ul data-spread="false"> <li> <p><strong>EBITDA</strong> grew from ₹164 Cr in FY23 to ₹375 Cr in FY25, with the <strong>EBITDA margin</strong> expanding from 55.2% to 67.4%. This reflects:</p> <ul data-spread="false"> <li> <p>Operational efficiency from technology-led processes, reducing costs relative to revenue.</p> </li> <li> <p>Scaling benefits as AUC and client base (4,800+ active custody clients in FY25) grow.</p> </li> </ul> </li> <li> <p><strong>PAT</strong> increased from ₹90 Cr in FY23 to ₹205 Cr in FY25, with the <strong>PAT margin</strong> rising from 30.3% to 36.9%. The consistent margin expansion highlights Orbis’s ability to convert revenue growth into profitability.</p> </li> </ul> </li> </ol> <h3>Cash Flow Analysis of Orbis Financial Unlisted Shares</h3> <p><img src="https://unlistedzone.com/storage/knowledge-logo/app_image-1757486260.jpg" alt="" width="738" height="455" /></p> <ol start="1" data-spread="false"> <li> <p><strong>Cash Flow from Operations (CFO)</strong>:</p> <ul data-spread="false"> <li> <p>FY25 saw a negative CFO of ₹109 Cr, compared to a positive ₹23 Cr in FY24 and a negative ₹182 Cr in FY23. The volatility is attributed to:</p> <ul data-spread="false"> <li> <p>A significant ₹436 Cr outflow in working capital changes in FY25, typical for custodians handling client money and margin flows.</p> </li> <li> <p>Custodial businesses often experience cash flow swings due to the timing of client fund settlements and margin requirements in equity, commodity, and currency derivatives.</p> </li> </ul> </li> <li> <p>Despite the negative CFO, Orbis’s business remains fundamentally strong, as evidenced by its profitability and zero-debt balance sheet.</p> </li> </ul> </li> <li> <p><strong>Cash Flow from Investing (CFI)</strong>:</p> <ul data-spread="false"> <li> <p>CFI was negligible in FY25 (₹2 Cr), down from ₹66 Cr in FY24. This suggests limited capital expenditure or investments in FY25</p> </li> <li> <p>The negative CFI in FY23 (-₹77 Cr) likely reflects earlier investments in infrastructure or tech upgrades.</p> </li> </ul> </li> <li> <p><strong>Cash Flow from Financing (CFF)</strong>:</p> <ul data-spread="false"> <li> <p>FY25 saw a negative CFF of ₹107 Cr, possibly due to dividend payouts or share buybacks, as Orbis has no borrowings.</p> </li> <li> <p>In contrast, FY24’s positive CFF (₹28 Cr) and FY23’s ₹67 Cr suggest prior capital-raising activities or inflows from shareholders.</p> </li> </ul> </li> <li> <p><strong>Net Cash Flow</strong>:</p> <ul data-spread="false"> <li> <p>The net cash flow in FY25 was negative at ₹214 Cr, driven by the negative CFO and CFF.The negative cash flow is largely due to working capital volatility, a common feature in custodial businesses.</p> </li> </ul> </li> </ol> <h2>Balance Sheet Strength of Orbis Financial Unlisted Shares</h2> <p><img src="https://unlistedzone.com/storage/knowledge-logo/app_image-1757486283.jpg" alt="" width="600" height="339" /></p> <ol start="1" data-spread="false"> <li> <p><strong>Total Assets</strong>:</p> <ul data-spread="false"> <li> <p>Total assets decreased from ₹5,040 Cr in FY23 to ₹4,296 Cr in FY25. Due to A contraction in client-driven assets (e.g., custodial funds or margin balances), which are volatile in nature.</p> </li> <li> <p>Despite the decline, the asset base remains substantial for a company with 192 employees and an asset-light model.</p> </li> </ul> </li> <li> <p><strong>Shareholders’ Funds</strong>:</p> <ul data-spread="false"> <li> <p>Shareholders’ funds nearly doubled from ₹429 Cr in FY23 to ₹899 Cr in FY25, reflecting:</p> <ul data-spread="false"> <li> <p>Retained earnings from strong PAT growth (₹205 Cr in FY25).</p> </li> <li> <p>Possible capital infusions or revaluation of reserves.</p> </li> </ul> </li> <li> <p>The increase in net worth strengthens Orbis’s ability to absorb market or operational shocks.</p> </li> </ul> </li> <li> <p><strong>Zero Borrowings</strong>:</p> <ul data-spread="false"> <li> <p>Orbis’s debt-free status across all three years is a significant strength, reducing financial risk and interest costs.</p> </li> </ul> </li> <li> <p><strong>Liquidity and Resilience</strong>:</p> <ul data-spread="false"> <li> <p>Despite negative cash flows in FY25, Orbis’s liquidity remains robust, supported by:</p> <ul data-spread="false"> <li> <p>A strong net worth (₹899 Cr).</p> </li> <li> <p>High EBITDA margins (67.4%), indicating cash-generative operations.</p> </li> <li> <p>No debt obligations, providing flexibility to manage working capital swings.</p> </li> </ul> </li> </ul> </li> </ol> <h2>E) Management Discussion & Analysis (MD&A) on Orbis Financial Unlisted Shares</h2> <ul data-spread="false"> <li> <p><strong>Market Outlook</strong>: Rising FPI flows, AIF/PMS growth, and expanding domestic capital markets bode well for Orbis.</p> </li> <li> <p><strong>Risks</strong>:</p> <ul data-spread="false"> <li> <p>Regulatory changes in custody/clearing norms.</p> </li> <li> <p>Heavy dependence on institutional capital market activity.</p> </li> <li> <p>Cash flow volatility due to working capital swings.</p> </li> </ul> </li> <li> <p><strong>Strategic Roadmap</strong>:</p> <ul data-spread="false"> <li> <p>Expansion into <strong>GIFT City</strong> for offshore funds.</p> </li> <li> <p>Strengthening tech-driven solutions for custody & fund accounting.</p> </li> <li> <p>Diversifying client mix to reduce dependence on FPIs.</p> </li> </ul> </li> </ul> <h2>F) Shareholding Pattern (2025) of Orbis Financial Unlisted Shares</h2> <p><img src="https://unlistedzone.com/storage/knowledge-logo/app_image-1757487126.jpg" alt="" width="769" height="423" /></p> <p>Promoter + key investors collectively hold a significant stake, reflecting <strong>skin in the game</strong>.</p> <h2>G) Valuation Insights (Unlisted Market) of Orbis Financial Unlisted Shares</h2> <ul data-spread="false"> <li> <p><strong>Current Price</strong>: ₹545 per share</p> </li> <li> <p><strong>Lot Size</strong>: 100 shares</p> </li> <li> <p><strong>Market Cap</strong>: ₹6,770 Cr</p> </li> <li> <p><strong>Valuation Ratios</strong>:</p> <ul data-spread="false"> <li> <p>P/E: 33.0x</p> </li> <li> <p>P/B: 7.45x</p> </li> <li> <p>ROE: 22.8%</p> </li> </ul> </li> </ul> <h2>H) Future Outlook og Orbis Financial Unlisted Shares</h2> <ul data-spread="false"> <li> <p><strong>Growth Opportunities</strong>:</p> <ul data-spread="false"> <li> <p>Rising participation of FPIs & AIFs in India.</p> </li> <li> <p>GIFT City as a gateway for global fund flows.</p> </li> <li> <p>Expanding demand for independent custodians outside bank-owned entities.</p> </li> </ul> </li> <li> <p><strong>Tailwinds</strong>: Strong India capital market activity, regulatory push for transparency.</p> </li> <li> <p><strong>Headwinds</strong>: Volatile cash flows, high dependency on institutional capital markets.</p> </li> </ul> <h2>I) UnlistedZone View</h2> <p>Orbis Financial is a <strong>rare play on India’s institutional capital market infrastructure</strong>. Its <strong>high-margin, asset-light, and debt-free business</strong> makes it an attractive bet for long-term investors.</p> <ul data-spread="false"> <li> <p><strong>Investment Thesis</strong>: Strong revenue growth, expanding margins, and institutional-grade client base.</p> </li> <li> <p><strong>Risks</strong>: Cash flow volatility, regulatory changes, and market dependency.</p> </li> <li> <p><strong>Suitability</strong>: Best suited for <strong>HNIs and long-term investors</strong> seeking exposure to India’s <strong>capital market backbone</strong> ahead of a potential future listing.</p> </li> </ul> <h2>Discliamer:</h2> <p>UnlistedZone is not a SEBI-registered Research Analyst or Investment Advisor. All information provided on our platform is strictly for educational and informational purposes. We do not offer investment advice or stock recommendations. Investors are advised to conduct their own due diligence or consult a SEBI-registered advisor. Investments in unlisted and pre-IPO shares are subject to market risks including illiquidity and volatility. UnlistedZone does not assure any returns or accept liability for investment outcomes based on this report.</p>

<p>Power Exchange India Limited (PXIL) has delivered a strong FY25 performance with solid growth in income, profit, and EPS — along with a dividend payout to shareholders. But the bigger story lies ahead: from January 2026, Market Coupling will bring a single national price for electricity, creating price uniformity, better transmission utilization, and growth opportunities for smaller exchanges like PXIL. This could be a true game changer for India’s power market.</p>
<h3 data-pm-slice="1 1 []">About the Company</h3> <p>President Systems, established in 1984, is a leading designer, manufacturer, and supplier of enclosure systems for IT, Telecom, and Industrial sectors. It became part of Schneider Electric in 2011, gaining global expertise and brand strength. The company operates from a fully integrated ISO 9000/14000 certified manufacturing facility in Attibele, Bangalore, spread across 200,000 sq. ft. Its offerings include standard and customized 19-inch racks, cabinets, card frames, and micro data center solutions. Over decades, it has built a strong presence in India while serving both domestic and international markets.</p> <h3>A) Business Model & Segments</h3> <p>President Systems follows a diversified yet focused portfolio approach:</p> <ul data-spread="false"> <li> <p><strong>Contract Manufacturing (CMFG)</strong> – 54% of revenue. Offers build-to-print solutions for global telecom OEMs and ATM manufacturers.</p> </li> <li> <p><strong>IT & Data Center Business</strong> – 20%. Provides racks and micro data centers for IT/ITES enterprises, BFSI, government, and defense.</p> </li> <li> <p><strong>Integrated Racks</strong> – 18%. Solutions for telecom, industrial automation, and smart city deployments.</p> </li> <li> <p><strong>Schneider Internal Group (IG)</strong> – 8%. Supplies to Schneider Electric’s global operations across multiple geographies.</p> </li> </ul> <p>This mix ensures revenue stability (volume-driven CMFG), profitability (IT/Integrated Racks), and guaranteed synergy (IG segment).</p> <h3>B) Industry Positioning</h3> <p>President Systems operates in the rapidly expanding <strong>data center infrastructure</strong> industry, aligned with key growth drivers:</p> <ul data-spread="false"> <li> <p>Cloud services market in India growing at <strong>25.8% CAGR</strong>, projected to reach USD 232.78 billion by 2033.</p> </li> <li> <p>Edge data center capacity expected to <strong>triple by 2027</strong> (200-210 MW from current 60-70 MW).</p> </li> <li> <p>Rising <strong>data consumption (27.5 GB/user per month)</strong> fueled by 5G adoption.</p> </li> <li> <p>India’s <strong>internet penetration at 55.3%</strong>, with 806 million users as of 2024.</p> </li> </ul> <p>The company’s integration with Schneider Electric positions it as a premium solutions provider, competing on value and innovation rather than price.</p> <h3>C) Key Highlights of FY 2025</h3> <ul data-spread="false"> <li> <p><strong>Revenue</strong>: ₹4,569.9 Mn (₹457 Cr), up <strong>16.3% YoY</strong>.</p> </li> <li> <p><strong>EBIT Margin</strong>: 12.5%, expanding by <strong>285 bps</strong>.</p> </li> <li> <p><strong>PAT</strong>: ₹48 Cr, up from ₹30 Cr in FY24.</p> </li> <li> <p><strong>Free Cash Flow</strong>: ₹336.2 Mn (₹33.62 Cr), confirming strong cash conversion.</p> </li> <li> <p><strong>ROCE</strong>: 28.3% (up 570 bps), reflecting world-class efficiency.</p> </li> <li> <p><strong>Debt</strong>: Virtually nil (Debt-Equity: 0.01).</p> </li> <li> <p><strong>Cash Balance</strong>: ₹74 Cr in 2025, up from ₹1.3 Cr in 2022.</p> </li> </ul> <h3>D) Financial Performance (2022–2025)</h3> <p><img src="https://unlistedzone.com/storage/knowledge-logo/app_image-1757399427.jpg" alt="" width="792" height="797" /></p> <h3>E) Cash Flow Analysis (2022–2025) </h3> <p><img src="https://unlistedzone.com/storage/knowledge-logo/app_image-1757399454.jpg" alt="" width="654" height="351" /></p> <p><strong>Cash Flow:</strong> CFO was volatile (₹6.4 Cr, ₹68.4 Cr, -₹0.6 Cr, ₹38 Cr) due to working capital swings, but underlying cash generation remains strong.</p> <h3>F) Balance Sheet Strength</h3> <p><img src="https://unlistedzone.com/storage/knowledge-logo/app_image-1757399479.jpg" alt="" width="753" height="430" /></p> <ul data-spread="false"> <li> <p><strong>Debt-Free</strong>: Borrowings reduced to zero in FY23 and FY25.</p> </li> <li> <p><strong>Equity Growth</strong>: Shareholders’ equity increased from ₹107 Cr to ₹200 Cr via retained earnings.</p> </li> <li> <p><strong>Liquidity</strong>: Current ratio improved to 3.02, indicating excellent short-term financial health.</p> </li> <li> <p><strong>Inventory Turnover</strong>: 13.49, highlighting highly efficient operations.</p> </li> </ul> <h3>G) Segment-Wise Analysis (FY 2025)</h3> <p><img src="https://unlistedzone.com/storage/knowledge-logo/app_image-1757399622.jpg" alt="" width="699" height="431" /></p> <h3>H) Management Discussion & Analysis</h3> <p><strong>Strengths:</strong> Market leadership, Schneider Electric backing, strong profitability (NPM >10%), robust balance sheet.</p> <p><strong>Weaknesses:</strong> Customer concentration in IT/Telecom, working capital volatility, susceptibility to import competition.</p> <p><strong>Opportunities:</strong> Cloud/AI adoption, Edge data center boom, IndiaAI initiatives, rising 5G/data consumption.</p> <p><strong>Threats:</strong> High competition, price pressure, commodity price fluctuations, cyclical IT spending.</p> <p><strong>Strategic Roadmap:</strong> Management is focusing on pricing discipline, cost optimization, and strategic capital allocation. The sharp decline in low-margin trading revenue confirms focus on high-value finished goods.</p> <h3>Shareholding Pattern (FY 2025)</h3> <ul data-spread="false"> <li> <p><strong>Promoter (Schneider Electric):</strong> 74.12%</p> </li> <li> <p><strong>Public Shareholding:</strong> 25.88%</p> </li> </ul> <h3>I) Valuation Insights (Unlisted Market)</h3> <ul data-spread="false"> <li> <p><strong>Unlisted Share Price:40</strong></p> </li> <li> <p><strong>Market Cap:</strong> Estimated at ₹387 Cr (Current Unlisted Market)</p> </li> <li> <p><strong>Valuation Ratios:</strong></p> <ul data-spread="false"> <li> <p>P/E: 8.06x</p> </li> <li> <p>P/B: 1.84x</p> </li> <li> <p>ROE: 24%</p> </li> </ul> </li> </ul> <h3>J) Future Outlook</h3> <p>President Systems is set to benefit disproportionately from India’s digital revolution:</p> <ul data-spread="false"> <li> <p>Rising demand from cloud/AI adoption.</p> </li> <li> <p>Expansion of edge data centers and decentralized IT infrastructure.</p> </li> <li> <p>Increasing telecom, BFSI, and government investments in secure infrastructure.</p> </li> <li> <p>Backing of Schneider Electric ensures global competitiveness.</p> </li> </ul> <h3>K) UnlistedZone View</h3> <p>President Systems (Schneider Electric) is a <strong>hidden gem</strong> in India’s unlisted market. It combines market leadership, strong financial health, world-class efficiency, and alignment with long-term digital infrastructure trends. With <strong>high ROCE (28.3%)</strong>, <strong>rapid EPS growth (₹80 in FY25)</strong>, and a <strong>debt-free balance sheet</strong>, it is a strong candidate for investors seeking exposure to India’s data economy.</p> <p><strong>Our Take:</strong> Suitable for HNIs and long-term investors. While competition and margin pressure are risks, the Schneider Electric synergy and sectoral tailwinds outweigh these challenges. We expect sustained profitability and potential value unlocking if the company pursues a listing in the coming years.</p> <h3>Disclaimer:</h3> <p>UnlistedZone is not a SEBI-registered Research Analyst or Investment Advisor. All information provided on our platform is strictly for educational and informational purposes. We do not offer investment advice or stock recommendations. Investors are advised to conduct their own due diligence or consult a SEBI-registered advisor. Investments in unlisted and pre-IPO shares are subject to market risks including illiquidity and volatility. UnlistedZone does not assure any returns or accept liability for investment outcomes based on this report.</p>

<h2 data-pm-slice="1 1 []">About the Company</h2> <h3>Brief History and Overview</h3> <p>Founded in 2008, <strong>Chennai Super Kings (CSK)</strong> is one of the most successful and popular franchises in the <strong>Indian Premier League (IPL)</strong>. The team plays its home matches at the <strong>M.A. Chidambaram Stadium, Chennai</strong>, and has been led by the legendary <strong>Mahendra Singh Dhoni</strong> for most of its journey.</p> <p>With <strong>5 IPL titles, 10 final appearances, and 12 playoff qualifications</strong>, CSK stands as one of the most consistent teams in the tournament’s history. Despite facing a two-year suspension in 2016-17, the franchise made a triumphant comeback by winning the IPL 2018 title.<br />As of late 2023/early 2024, the Chennai Super Kings (CSK) franchise was valued at approximately $1.5 billion (around ₹12,500 crores), according to a report by Houlihan Lokey.</p> <p>This makes it the second-most valuable franchise in the Indian Premier League (IPL), behind only the Mumbai Indians.</p> <p>The Chennai Super Kings won their fifth IPL title in 2023, equaling the record of their biggest rivals, the Mumbai Indians, for the most championships in IPL history.</p> <h2>Business Model (Core Operations, Segments)</h2> <ul data-spread="false"> <li> <p><strong>Central Rights (Media Rights, BCCI Grants)</strong> – Largest revenue contributor.</p> </li> <li> <p><strong>Sponsorships</strong> – Driven by CSK’s brand appeal and fan loyalty.</p> </li> <li> <p><strong>Tournament Earnings</strong> – Includes prize money and other tournament-related income.</p> </li> <li> <p><strong>Merchandise & Licensing</strong> – Jerseys, fan gear, and licensing/talent management.</p> </li> <li> <p><strong>Academy Ecosystem</strong> – Memberships, training fees, and facilities utilization.</p> </li> <li> <p><strong>Fan Engagement</strong> – Initiatives such as <strong>Fan Parks in 36 cities</strong> and strong digital presence (200M+ Hotstar viewership).</p> </li> </ul> <h2>Key Highlights of FY 2024-25</h2> <ul data-spread="false"> <li> <p><strong>Sporting Performance:</strong> Did not qualify for the IPL XVIII Knockouts.</p> </li> <li> <p><strong>Academy Growth:</strong> Membership income grew <strong>78.7% YoY</strong>; facility utilization rose <strong>92.9% YoY</strong>.</p> </li> <li> <p><strong>Merchandise Boom:</strong> Sales doubled to <strong>₹194.25 Lakhs</strong>.</p> </li> <li> <p><strong>Licensing/Talent Management:</strong> Up <strong>77.7% YoY</strong> to <strong>₹191.04 Lakhs</strong>.</p> </li> <li> <p><strong>Cost Pressure:</strong> Franchisee fees and administration costs surged significantly.</p> </li> </ul> <h2>Financial Performance (Consolidated)</h2> <p><img src="https://unlistedzone.com/storage/knowledge-logo/app_image-1757324769.jpg" alt="" width="600" height="432" /></p> <p><strong>Revenue Growth (YoY % Change)</strong>: Total turnover fell 4.8% YoY from ₹695 Cr in FY24 to ₹674 Cr in FY25, driven by a ₹19 Cr drop in tournament-related income (primarily due to no prize money in FY25).</p> <ul data-spread="false"> <li> <p><strong>Profit After Tax (PAT) and Margins</strong>: PAT declined 21.0% YoY to ₹18,094.22 Lakhs from ₹22,910.70 Lakhs, with margins contracting due to lower revenue and higher costs.</p> </li> </ul> <h3>Revenue Breakdown (₹ in Cr)</h3> <p><img src="https://unlistedzone.com/storage/knowledge-logo/app_image-1757324798.jpg" alt="" width="600" height="303" /></p> <p> <strong>Key Insight:</strong> Revenue fell <strong>3.1% YoY</strong> (~₹19 Cr), mainly due to no prize money in FY25.</p> <h3>Cost Breakdown (₹ in Cr)</h3> <p><img src="https://unlistedzone.com/storage/knowledge-logo/app_image-1757324845.jpg" alt="" width="600" height="303" /></p> <p>📌 <strong>Key Insight:</strong> Costs rose <strong>7.5% YoY</strong> (+₹31 Cr ), led by <strong>franchisee fee (+24.0%)</strong> and <strong>admin expenses (+15.9%)</strong>.</p> <h2>Balance Sheet Strength</h2> <p><img src="https://unlistedzone.com/storage/knowledge-logo/app_image-1757324866.jpg" alt="" width="600" height="303" /></p> <ul data-spread="false"> <li> <p><strong>Rapid Asset Growth:</strong> Total assets more than doubled from <strong>₹490 Cr (2023) to ₹1,132 Cr (2025)</strong>, showing massive expansion.</p> <ul data-spread="false"> <li> <p><strong>Virtually Debt-Free:</strong> Borrowings were slashed from <strong>₹65 Cr (2023) to zero (2024)</strong> and a minimal <strong>₹5 Cr (2025)</strong>, indicating a very strong, low-risk financial position.</p> </li> <li> <p><strong>Profit-Funded Growth:</strong> Reserves (accumulated profits) surged from <strong>₹298 Cr to ₹715 Cr</strong>, meaning the company funded its entire growth internally without relying on debt.</p> </li> <li> <p><strong>Strategic Cash Deployment:</strong> A huge increase in <strong>Investments (from ₹52 Cr to ₹308 Cr)</strong> shows the company is parking its excess profits for future opportunities. <strong>Healthy Liquidity:</strong> Supported by steady media rights & sponsorships.</p> </li> </ul> </li> </ul> <h2>Segment/Division-Wise Analysis</h2> <ul data-spread="false"> <li> <p><strong>Central Rights:</strong> 73.2% of revenue (₹493 Cr).</p> </li> <li> <p><strong>Sponsorship:</strong> 17.3% share, growing steadily.</p> </li> <li> <p><strong>Tournament Income:</strong> 8.0%, down sharply due to no prize money.</p> </li> <li> <p><strong>Academies & Merchandise:</strong> 1.8%, but growing fast with YoY gains above 75%-100%.</p> </li> </ul> <p> <strong>Insight:</strong> Diversification into academies, licensing, and merchandise is paying off, though media rights remain the dominant stream.</p> <h2><strong>CSK's Subsidiaries</strong></h2> <p><strong><img src="https://unlistedzone.com/storage/knowledge-logo/app_image-1757324896.jpg" alt="" width="800" height="374" /></strong></p> <h2><strong>Key Performance Insights (in points):</strong></h2> <ul data-spread="false"> <li> <p><strong>Superking Ventures (Academies):</strong></p> <ul data-spread="false"> <li> <p><strong>Financial Health:</strong> Despite negative reserves, it is the <strong>only profitable subsidiary</strong>, reporting a PAT of <strong>₹552.52 Lakhs</strong>.</p> </li> <li> <p><strong>Leverage:</strong> Has the highest liabilities, indicating it may be using debt to fund its rapid expansion.</p> </li> </ul> </li> <li> <p><strong>Joburg Super Kings (SA20):</strong></p> <ul data-spread="false"> <li> <p><strong>Scale:</strong> Has the <strong>highest turnover (₹4,530.38 Lakhs)</strong> among the subsidiaries.</p> </li> <li> <p><strong>Losses:</strong> Incurs the <strong>largest loss (₹3,279.96 Lakhs)</strong>, which is a common characteristic of sports franchises in a growth phase, investing heavily in player costs.</p> </li> </ul> </li> <li> <p><strong>Texas Super Kings (MLC):</strong></p> <ul data-spread="false"> <li> <p><strong>New Venture:</strong> Most recently acquired (Oct 2024). Its financials (negative reserves, loss of ₹712.18 Lakhs) reflect the <strong>initial high-investment phase</strong> of a new sports franchise.</p> </li> </ul> </li> <li> <p><strong>Super Kings International Inc.:</strong></p> <ul data-spread="false"> <li> <p><strong>Holding Company:</strong> Acts as the US holding entity that owns 55.5% of Texas Super Kings.</p> </li> <li> <p><strong>Profitability:</strong> Reported a small profit at the holding level, but this is offset by the losses of its subsidiary (Texas Super Kings) which are consolidated.</p> </li> </ul> </li> <li> <p><strong>Global Strategy:</strong> CSK's strategy of <strong>expanding its global footprint</strong> by investing in overseas T20 leagues (SA20, MLC) and building a network of cricket academies. The newer sports franchises are currently loss-making as they build their brand and fanbase, while the academy business has become profitable.</p> </li> </ul> <h3>Management Discussion & Analysis (MD&A)</h3> <ul data-spread="false"> <li> <p><strong>Outlook:</strong> Confident of a strong comeback in future IPL seasons, driven by brand power and fan loyalty.</p> </li> <li> <p><strong>Risks:</strong> Rising franchisee fees, dependence on central revenue, and performance-linked prize money.</p> </li> <li> <p><strong>Strategy:</strong> Expand academy ecosystem, boost merchandise sales, and deepen digital fan engagement.</p> </li> </ul> <h2>Valuation Insights (Unlisted Market)</h2> <ul data-spread="false"> <li> <p>CSK is among the <strong>most demanded unlisted shares</strong> in India.</p> </li> <li> <p>Backed by consistent profits, strong fan engagement, and iconic branding.</p> </li> <li> <p>Current Price: ₹185</p> </li> <li> <p>Valuation (Unlisted): ~ ₹7091 Cr</p> </li> <li> <p>P/E: 47.31</p> </li> <li> <p>P/B: 9.37</p> </li> </ul> <h2>Future Outlook</h2> <h3>Opportunities</h3> <ul data-spread="false"> <li> <p>IPL expansion and rising sponsorship pool.</p> </li> <li> <p>Strong digital monetization opportunities.</p> </li> <li> <p>Growing academy and licensing revenues.</p> </li> </ul> <h3>Headwinds</h3> <ul data-spread="false"> <li> <p>Rising costs (franchisee fees, admin expenses).</p> </li> <li> <p>Performance-linked earnings volatility.</p> </li> <li> <p>Competitive IPL sponsorship environment.</p> </li> </ul> <h2>UnlistedZone View</h2> <p>CSK remains a <strong>cash-rich, consistently profitable franchise</strong> with strong fundamentals. Short-term dips in profitability (like FY25) are linked to tournament outcomes, but the brand’s financial stability is unquestionable.</p> <p>📌 <strong>Our Take:</strong></p> <ul data-spread="false"> <li> <p><strong>Rating:</strong> Strong Buy (Long-Term)</p> </li> <li> <p><strong>Investment Thesis:</strong> Premium brand, resilient cash flows, and growth from academies & merchandise.</p> </li> <li> <p><strong>Risks:</strong> Performance volatility and rising franchisee fees.</p> </li> </ul> <p>CSK continues to be a <strong>defensive yet growth-oriented unlisted investment</strong> for those looking to tap into India’s sports economy.</p> <h3>Disclaimer :</h3> <p>UnlistedZone is not a SEBI-registered Research Analyst or Investment Advisor. All information provided on our platform is strictly for educational and informational purposes. We do not offer investment advice or stock recommendations. Investors are advised to conduct their own due diligence or consult a SEBI-registered advisor. Investments in unlisted and pre-IPO shares are subject to market risks including illiquidity and volatility. UnlistedZone does not assure any returns or accept liability for investment outcomes based on this report</p>
<h3>About the Company</h3> <p><strong>Brief History and Overview</strong><br />Nayara Energy, formerly Essar Oil, is an integrated downstream oil company operating across the hydrocarbon value chain. Acquired in 2016 by a consortium led by Rosneft, Trafigura, and UCP Investment Group, the company has since rebranded and expanded its refining, trading, retail, and petrochemical operations. It prioritizes health, safety, environment, and community well-being, embedding HSE across all activities.</p> <h3>Business Model of Nayara Energy </h3> <ul data-spread="false"> <li> <p><strong>Core Operations:</strong> Refining crude into gasoline, diesel, jet fuel, polypropylene, and petrochemicals. FY25 crude processing: 20.49 MMT with 102.3% capacity utilization.</p> </li> <li> <p><strong>Trading:</strong> Procured 146.4 MM BL of crude across 129 grades, engaging in both supply and global trading.</p> </li> <li> <p><strong>Retail:</strong> ~6,683 outlets (~7% of India’s network), average throughput of 8.3 KL per outlet.</p> </li> <li> <p><strong>Subsidiaries:</strong></p> <ul data-spread="false"> <li> <p><em>Nayara Energy Singapore Pte Ltd (NESPL):</em> Trading, sourcing, export placements.</p> </li> <li> <p><em>Coviva Energy Terminals Ltd:</em> Developing SBM-2 at Deendayal Port.</p> </li> </ul> </li> <li> <p><strong>Segments:</strong> Refining, trading, retail, institutional business, petrochemicals, sustainability (biofuels, renewables).</p> </li> </ul> <h3>Industry Positioning of Nayara Energy Limited</h3> <ul data-spread="false"> <li> <p>Contributes <strong>8% of India’s refining capacity</strong> and <strong>8% of polypropylene capacity</strong>.</p> </li> <li> <p>Specializes in processing ultra-heavy crudes (96.1% of input).</p> </li> <li> <p>Workforce: 55,000+ direct and indirect employees.</p> </li> <li> <p>Safety record: <strong>25.12 million safe man-hours, TRIR of 0.058</strong>, outperforming industry averages.</p> </li> </ul> <h3>Key Highlights of FY24-25 Nayara Energy Unlisted Shares</h3> <ul data-spread="false"> <li> <p><strong>HSE:</strong> Launched Nayara Energy HSE Management System; improved contractor safety and road risk management.</p> </li> <li> <p><strong>Sustainability:</strong> 12.7% ethanol blending; solar at 1,000+ outlets; desalination, rainwater harvesting, waste management.</p> </li> <li> <p><strong>IT:</strong> Cloud migration, cybersecurity upgrades, CTRM modernization, AI/analytics in HR and operations.</p> </li> <li> <p><strong>Expansion:</strong> Commissioned polypropylene plant, progressing ethanol projects, SBM-2 setup.</p> </li> </ul> <h3>Financial Performance Of Nayara Energy Unlisted Shares</h3> <h3><strong>P&L Snapshot (₹ Cr):</strong></h3> <p><strong><img src="https://unlistedzone.com/storage/knowledge-logo/app_image-1757076008.jpg" alt="" width="658" height="474" /></strong></p> <ol start="1" data-spread="false"> <li> <p><strong>Revenue Growth (YoY % Change)</strong>: FY25 revenue declined 3.8% YoY from FY24 (₹155,091 Cr to ₹149,217 Cr), but grew 8.0% from FY23 (₹138,112 Cr).</p> </li> <li> <p><strong>EBITDA, PAT, Margins</strong>: EBITDA fell 43.3% YoY to ₹11,187 Cr, with margins compressing to 7.50% due to lower gross margins (26.11% vs. 30.95%). PAT dropped 50.7% YoY to ₹6,079 Cr, with margins at 4.07%, reflecting higher costs or market pressures.</p> </li> <li> <p><strong>EPS and Book Value</strong>: EPS halved to ₹40.33 from ₹81.75; book value implied from reserves and share capital growth (reserves up to ₹48,503 Cr from ₹41,984 Cr).</p> </li> </ol> <h3><strong>Cash Flow (₹ Cr):</strong></h3> <p><strong><img src="https://unlistedzone.com/storage/knowledge-logo/app_image-1757076139.jpg" alt="" width="628" height="445" /></strong></p> <p>Positive operational cash flow declined slightly YoY, indicating stable but pressured core operations. Investing outflows reduced (less capex), while financing outflows eased. Net positive in FY25 vs. negative in FY24, showing improved liquidity.</p> <h3><strong>Balance Sheet (₹ Cr):</strong></h3> <p><strong><img src="https://unlistedzone.com/storage/knowledge-logo/app_image-1757076165.jpg" alt="" width="801" height="510" /></strong></p> <ul data-spread="false"> <li> <p><strong>Assets, Liabilities, and Equity Changes</strong>: Total assets dipped 2.6% YoY to ₹85,448 Cr, driven by lower investments; fixed assets rose 9.5% due to expansions. Borrowings increased 7.0%, but reserves grew 15.5%, boosting net worth.</p> </li> <li> <p><strong>Debt/Equity Ratio, Net Worth, Reserves</strong>: D/E improved to 0.25 (low leverage); net worth strengthened with reserves at ₹48,503 Cr.</p> </li> <li> <p><strong>Liquidity Position</strong>: Current ratio improved to 1.39 from 1.13, indicating better short-term solvency.</p> </li> </ul> <p>Post-buyback (after March 31, 2025), paid-up capital reduced to 148,83,90,808 shares of ₹10 each (₹1488 Cr total), following buyback of 21,70,347 shares (8.38% of offer) at ₹731/share for ₹158 Cr.</p> <p> </p> <h3><strong>Segment Sales (₹ Cr):</strong></h3> <p><strong><img src="https://unlistedzone.com/storage/knowledge-logo/app_image-1757076186.jpg" alt="" width="581" height="412" /></strong></p> <ol start="1" data-spread="false"> <li> <p><strong>Contribution of Different Business Segments</strong>: Manufactured goods dominate (90.6% of revenue in FY25), down 3.9% YoY. Traded goods (9.2%) fell 2.5%. Retail outlets grew 7.4% YoY, contributing 42% of sales, showing strong domestic consumer demand. Exports declined 8.8%, while institutional/petrochemical rose 14.1%.</p> </li> <li> <p><strong>Regional or Product-Level Performance</strong>: Domestic segments (retail + oil companies + institutional) total ~74% of sales, up from FY24 mix. Retail strength aligns with 6,683 outlets; petrochemicals leverage 8% national capacity.</p> </li> </ol> <h3>Management Discussion & Analysis on Nayara Energy Unlisted Shares</h3> <ul data-spread="false"> <li> <p><strong>Outlook:</strong> Growth in decarbonization, renewables, and efficiency amid evolving regulations (CCTS, 20% ethanol blending by 2025).</p> </li> <li> <p><strong>Risks:</strong> Crude price volatility, evolving regulations, CSR execution delays.</p> </li> <li> <p><strong>Roadmap:</strong> 7-pronged decarbonization (biofuels, hydrogen, CCU, renewables); strengthen HR, CSR, IT resilience, and governance.</p> </li> </ul> <h3>Shareholding Pattern of Nayara Energy Unlisted Shares</h3> <ul data-spread="false"> <li> <p><strong>Rosneft Singapore Pte. Limited</strong> is the largest shareholder with a <strong>49.13%</strong> stake.</p> </li> <li> <p><strong>Kesani Enterprises Company Limited</strong> holds shares in two forms:</p> <ul data-spread="false"> <li> <p><strong>Global Depositary Shares (GDS):</strong> <strong>31.92%</strong></p> </li> <li> <p><strong>Equity Shares:</strong> <strong>17.21%</strong></p> </li> </ul> </li> <li> <p>The combined holding of <strong>Kesani Enterprises Company Limited</strong> is <strong>49.13%</strong> (31.92% + 17.21%).</p> </li> <li> <p><strong>Other</strong> shareholders hold a <strong>1.73%</strong> stake in the company.</p> </li> <li> <p>Post-buyback equity: 148.83 Cr shares.</p> </li> <li> <p>Buyback at ₹731/share (~₹1,586 Cr) reduced minority holding.</p> </li> </ul> <h3>Valuation Insights of Nayara Energy Unlisted Shares</h3> <ul data-spread="false"> <li> <p>Implied Market Cap: ~₹134151 Cr (post-buyback @ ₹731/share).</p> </li> <li> <p><strong>Valuation ratios:</strong> <strong>P/E</strong> 22.07x, <strong>P/B</strong> ~2.68, <strong>EV/EBITDA</strong> ~ 11.87</p> <h3>Peers Comparison</h3> <img src="https://unlistedzone.com/storage/knowledge-logo/app_image-1757076220.jpg" alt="" width="646" height="406" /></li> </ul> <h3>Future Outlook of Nayara Energy Unlisted Shares</h3> <ul data-spread="false"> <li> <p><strong>Opportunities:</strong> Ethanol expansion, petrochemicals, SBM-2, renewables, digitalization.</p> </li> <li> <p><strong>Risks:</strong> Margin pressure, global crude volatility, regulatory shifts.</p> </li> <li> <p><strong>Suitability:</strong> Attractive for HNIs/long-term investors seeking downstream oil + ESG exposure.</p> </li> </ul> <h3>UnlistedZone View on Nayara Energy Unlisted Shares </h3> <p><strong>Thesis:</strong> Strong integrated model, ESG leadership, retail and petrochemical growth, Rosneft-backed stability.<br /><strong>Risks:</strong> Earnings volatility, CSR execution gaps, heavy crude reliance.<br /><strong>Call:</strong> Compelling long-term hold; undervalued vs peers; ideal for patient investors in India’s energy transition.</p> <p><strong>For More Information Visit : <a href="https://unlistedzone.com/shares/buy-sell-share-price-essar-oil-limited-unlisted-shares/">UnlistedZone</a></strong></p> <p><strong>Disclaimer: </strong>UnlistedZone is not a SEBI-registered Research Analyst or Investment Advisor. All information provided on our platform is strictly for educational and informational purposes. We do not offer investment advice or stock recommendations. Investors are advised to conduct their own due diligence or consult a SEBI-registered advisor. Investments in unlisted and pre-IPO shares are subject to market risks including illiquidity and volatility. UnlistedZone does not assure any returns or accept liability for investment outcomes based on this report.</p>

<p>Greenzo Energy is setting up green hydrogen power plant for Jindal Stainless in Odisha — a big step towards clean energy.</p>

Indicative prices, company research and your enquiries — in your pocket. Get price notes on the names you follow and reach our team from anywhere.