Blogs, insights, guides and videos on India's unlisted market — all in one place.

LAVA which has a wide product portfolio that encompasses tablets, feature phones, and smartphones having various models in bar at multiple price points to suit all categories of consumers, is looking to make a mark in the smart phone industry in India which is dominated by Chinese players like BBK which owns brands like VIVO, One-plus and OPPO and Xiaomi with brand like Redmi and Mi having more than 60% market share.<!--more--> As per commentary from the management, they are looking to acquire market share of 5% at the end of this financial year. Lava is a dominant player in feature phone category with 20% market share but due to rise in demand for smart phones in India even at lower strata of population, they are building smart phones in 4G and 5G technology. In the first of its kind experiment, Lava in January launched a smart phone a "made-to-order" which allows users to make a smartphone as per their requirements. For example, if you need more RAM, same can be increased or phone running out of space, same can be increased. So, this looks a very good prospect as far as user experience is concerned. Lava founder Shri Hari Om Rai is the man behind launching of PLI scheme is India for mobile manufacturing and they are the front runner in getting chance to make phone under this scheme. As per scheme, every participant has to put some minimum investment and have to manufacture minimum number of mobile phones. However, due to pandemic situation Lava like other players did not meet the criteria. However, they are hopeful for meeting the same this fiscal year.
<p>The Dr Shield Face Mask by STUDDS is a state-of-the-art FFP2 grade respiratory mask, designed to offer robust protection against pollution, dust, and various viruses and microbes. This advanced face mask is crafted with five distinct layers, each serving a specific purpose in filtration and protection.</p> <p>The first layer, made from non-woven fabric, acts as the initial barrier, filtering out larger dust particles. The second layer, also constructed from non-woven fabric, targets particles larger than 10 microns. The crucial third and fourth layers consist of high-grade melt-blown fabric, which is key in filtering out particulate matter as small as PM 2.5 microns. Finally, the fifth layer, made from non-woven fabric, provides additional fine filtration, ensuring comprehensive protection.</p> <p>Not only is the mask highly effective in filtration, but it also emphasizes user comfort. It includes a nose clip for a secure and snug fit, ensuring perfect sealing. This feature also helps in maintaining optimal pressure during both inhalation and exhalation. Adding to the user's peace of mind, the masks are pre-sanitized and intended for one-time use.</p> <p>Priced at Rs.125, the Dr Shield Face Mask by STUDDS is a premium choice for those seeking high-level protection combined with comfort in their daily lives.</p>
Haldiram is a no new name to Indian households and families. The brand is highly renowned amongst all classes and sections of the society. The business has grown leaps and bounds through its sheer exemplary efficiency from being extraordinary amongst the ordinary. The story of the iconic bhujia maker is quite inspirational. It grew from a small namkeen shop in Bikaner, Rajasthan into a multi-billion dollar company. It began in 1918 as a part-time hobby for extra income has today become a behemoth enterprise in the food industry in India generating over to Rs. 7000 crore in annual revenues combining the business of Kolkata, Delhi, and Nagpur Groups<!--more--> <strong>Beginning of the Story and forming Haldiram in 1938</strong> At the age of 12 , when most children went to school, Ganga Bhishen Agarwal spent his days in Bikaner inventing the omnipresent snack Bhujia. Soon Haldiram bhujia became irresistible to customers. The most important changes he made to the bhujia was making it out of 'moth dal' Moth lentils rather than besan. This amendment in delicacy changed his life overnight as moth is very popular and easily available in Rajasthan. He also focussed on making it the fine crispy bhujia we know today transforming it from the fat, slightly bland version from before his time. The boy in his early days in business also demonstrated a knack for marketing by setting the price point such that the product was more exclusive and not just considered a commodity, selling for 5 paise a kilo as opposed to the earlier 2 paise under his grandfather Bhikharam. Determined to take bhujia beyond the boundaries of Bikaner, they shifted base to Nagpur in 1970. Their they had opened first full-production unit to introduce a delectable variety of savouries, sweets and beverages to the market. The success of this venture led them to expand and evolve as a brand, that is an integral part of every Indian household today. Today, the company has three areas of operations with Delhi-based Haldiram Snacks and Ethnic Foods in the northern region, Nagpur-based Haldiram Foods International in western and southern regions and a much smaller Kolkata-based Haldiram Bhujiawala in the eastern region. <strong>Timeline of History and Family Dispute</strong> <ol> <li style="list-style-type: none;"> <ol> <li><strong>1937</strong> - <span class="JsGRdQ">The Haldiram story began in 1937, when Gangabhisan Agarwal set up shop in Bikaner.</span></li> <li><strong>1955</strong>- <span class="JsGRdQ">Kolkata was the first of the family's forays outside home, when Rameshwarlal Agarwal, Gangabhisan's youngest son, set up the "Haldiram Bhujiawala" in the Burrabazar area.</span></li> <li><strong>1970</strong> - <span class="JsGRdQ">Success of Kolkata shop and to cater the rising demand of products they had opened their first manufacturing unit in Nagpur.</span></li> <li><strong>1983</strong> - <span class="JsGRdQ">First retail outlet was setup in Delhi. This has got very good response from Delhi crowd and as well as among the tourists.</span></li> <li><strong>1990</strong> - The Agarwal siblings split in the early 1990s, dividing business operations in four different zones. While Manoharlal and Madhusudan got the north Indian markets, Shiv Kishan the south and west markets, and Prabhu Shankar and Ashok the markets in east India.</li> <li><strong>1999</strong>- The matter had gone to court for the use of Brand name of Haldiram.</li> </ol> </li> </ol> <strong>From Rags to Riches</strong> The business that began in a small shop now spans not only all regions of the country, but also marks its presence in international markets. It has a tremendous presence across the globe. In contemporary times, Haldiram products are exported to several countries worldwide, including Sri Lanka, United Kingdom, United States, Canada, United Arab Emirates, Australia, New Zealand, Japan, Thailand, and others. Haldiram boast of its portfolio of over 400 products, ranging from <em>Namkeens</em> and <em>Snacks</em>, <em>Sweets</em>, <em>Refreshment drinks</em>, <em>Frozen foods</em>, <em>Ready to cook dishes</em> and <em>Quick-service restaurants.</em> <strong>Manufacturing Units </strong>The Nagpur headquartered company has manufacturing plants in Nagpur, New Delhi, Kolkata, Bikaner. Haldiram has its own retail chain stores and a range of restaurants in Nagpur and Delhi. <strong>Positioning</strong> The initiatives undertaken by the company helped Haldiram to uniquely position its brand. Haldiram also gained an edge over its competitors by minimizing promotion costs. Success of Haldiram is a sheer example of 'word of mouth' or 'mouth to mouth' publicity. Appreciating the company's efforts at building a brand, an analyst said, "Haldiram once was just another sweet maker but it has moved into trained brands first by improving the product quality and packaging. Through its clever products and brilliant distribution it had moved into the star category of brands." <strong>Steps ahead in Leadership</strong> In 1994, the unit was awarded the International Award for Food & Beverages by the Trade Leaders Club in Barcelona, Spain. The unit also received the Brand Equity Award15 in 1998. Manoharlal Agarwal, who played a key role in the success of the Delhi unit, was included in the eighth edition of Distinguished Leadership by the Board of Registrars of The American Biographical Institute16. Haldiram was also admitted as a member of Snack Food Association, US. <strong>From Bikaner shop to French Bakery</strong> While largely remaining closely guarded from the prying eyes of the public, Manohar Lal Agarwal and his brother have been pushing boundaries in the business. The recent venture with the second largest bakery chain in the world, Brioche Dorée, is proof that Haldiram is set on broadening their reach. For the first time, the bakeries will only be serving vegetarian food tailored to the Indian market. Similar to PepsiCo in the past, breakfast products giant Kellogg’s has also recently shown interest in partnering with or buying a stake in Haldiram (Nagpur and Delhi enterprises), valuing them at $3 billion. <strong>Pricing</strong> Haldiram charge a decent premium owing to the branded and well packaged products. They give a huge importance to good presentation and lively packaging as a way of differentiation from other non-branded unorganised products and thus demand a premium for it. But since the premium is so small that consumers usually don’t mind given the trusted high-quality products. At the same Haldiram, is facing stiff competition from other branded competitors like Bikaji, Lehar, Bikano etc. Thus the pricing has been the key factor contributing to their success. Thus competitive pricing is the backbone of its marketing mix business strategy. To charm the more price sensitive customers, Haldiram has come up with small one-time consumption packages of 40 grams which are priced at Rs. 10 for its most famous Bhujia. Company has introduced different products under various weights, which have different pricing. <strong>Marketing Strategies:</strong> From the initial days onwards Haldiram never invested much in Marketing and advertising to expand his brand they gained their business majorly through word of mouth. But now due to the intense competition, they realized the importance of marketing and advertisement and started gaining attention from them. One of the major recent campaigns is with Haldiram tied up with a Bollywood movie under Rajshri production 'Prem Ratan Dhan Payo', starring Salman Khan and Sonam Kapoor. It launched a contest for promotions through which they distributed 1.5 crore packets of snacks. The family business of Haldiram is divided into 4 main entities having businesses in North India, South & West and East Market and having combined revenue in excess of 7000 crores. Below, we are analyzing the financials of one of the group company called <strong>Haldiram Snacks Private Limited having business in the North Indian markets.</strong> <strong>Shareholding Pattern</strong> Haldiram Snacks Private Limited is largely owned by a couple of trusts, holding 64.67% stake in the <em>Sweets</em> and <em>Namkeen</em> maker. According to the details till FY 2019-20, Radhe Krishna Trust holds 39.53% and Annapurna Trust holds 25.14% stake in the company. Haldiram manufacturing company has 15.94% stake of the Haldiram Snacks. <img class="alignnone wp-image-15550" src="https://unlistedzone.com/storage/knowledge-logo/Haldirams-Shareholding-Pattern.png" alt="" width="358" height="358" /> <strong>Cash Flow (Fig. in Crores)</strong> In year 2019 and 2020, the company has generated negative free cash flow due to higher capital expenditure. However, cash flow of the company is constantly rising, except a sharp fall in 2019, when its cash flow plunged 60.8% to Rs 194 crore, compared to Rs 496 crore in 2018. In 2020, it managed a cash flow of Rs 372 crore, 91% higher than the previous year. <div class="table-overflow-init"> <table width="100"> <tbody> <tr> <td width="210">Particulars</td> <td width="78">2015</td> <td width="77">2016</td> <td width="74">2017</td> <td width="88">2018</td> <td width="76">2019</td> <td width="78">2020</td> </tr> <tr> <td>Cash Flow from Oprating Act</td> <td>216</td> <td>334</td> <td>305</td> <td>496</td> <td>194</td> <td>372</td> </tr> <tr> <td>Capital Expenditure</td> <td>144</td> <td>223</td> <td>233</td> <td>387</td> <td>424</td> <td>494</td> </tr> <tr> <td>Free Cash Flow</td> <td>72</td> <td>111</td> <td>72</td> <td>109</td> <td>-230</td> <td>-122</td> </tr> <tr> <td>Cash Flow from Investing Act</td> <td>-140</td> <td>-283</td> <td>-233</td> <td>-344</td> <td>-314</td> <td>-478</td> </tr> <tr> <td>Cash Flow from Financing Act</td> <td>-72</td> <td>-54</td> <td>-64</td> <td>-68</td> <td>137</td> <td>38</td> </tr> </tbody> </table> </div> <strong>Balance Sheet</strong> <div class="table-overflow-init"> <table width="100"> <tbody> <tr> <td width="210">Particulars</td> <td width="78">2015</td> <td width="77">2016</td> <td width="74">2017</td> <td width="88">2018</td> <td width="76">2019</td> <td width="78">2020</td> </tr> <tr> <td>Share Capital</td> <td>33</td> <td>33</td> <td>33</td> <td>33</td> <td>33</td> <td>33</td> </tr> <tr> <td>Reserves</td> <td>542</td> <td>604</td> <td>852</td> <td>1107</td> <td>1469</td> <td>1774</td> </tr> <tr> <td>Borrowings</td> <td>320</td> <td>286</td> <td>238</td> <td>183</td> <td>335</td> <td>401</td> </tr> <tr> <td>Other Liabilities</td> <td>187</td> <td>216</td> <td>250</td> <td>353</td> <td>404</td> <td>533</td> </tr> <tr> <td>Total Liabilities</td> <td>1083</td> <td>1139</td> <td>1372</td> <td>1676</td> <td>2240</td> <td>2741</td> </tr> <tr> <td>Fixed Assets</td> <td>653</td> <td>755</td> <td>813</td> <td>802</td> <td>888</td> <td>1103</td> </tr> <tr> <td>Capital WIP</td> <td>38</td> <td>68</td> <td>83</td> <td>265</td> <td>380</td> <td>446</td> </tr> <tr> <td>Investments</td> <td>24</td> <td>68</td> <td>70</td> <td>159</td> <td>222</td> <td>217</td> </tr> <tr> <td>Other Assets</td> <td>369</td> <td>248</td> <td>406</td> <td>451</td> <td>750</td> <td>975</td> </tr> <tr> <td>Total Assets</td> <td>1083</td> <td>1139</td> <td>1372</td> <td>1676</td> <td>2240</td> <td>2741</td> </tr> </tbody> </table> </div> <strong>Profit and Loss</strong> <div class="table-overflow-init"> <table width="100"> <tbody> <tr> <td width="210">Particulars</td> <td width="78">2015</td> <td width="77">2016</td> <td width="74">2017</td> <td width="88">2018</td> <td width="76">2019</td> <td width="78">2020</td> </tr> <tr> <td>Sales</td> <td>1,770</td> <td>2,004</td> <td>2,449</td> <td>2,623</td> <td>3,094</td> <td>3,801</td> </tr> <tr> <td>Cost of Materials Consumed</td> <td>1,078</td> <td>1,196</td> <td>1,529</td> <td>1,363</td> <td>1,800</td> <td>2,194</td> </tr> <tr> <td>Purchase of Stock in Trade</td> <td>21</td> <td>20</td> <td>37</td> <td>215</td> <td>133</td> <td>246</td> </tr> <tr> <td>Change in Inventory</td> <td>-10</td> <td>-0.05</td> <td>-0.28</td> <td>6.20</td> <td>-32.80</td> <td>-3.53</td> </tr> <tr> <td>Employee Benefit Expenses</td> <td>110</td> <td>124</td> <td>159</td> <td>174</td> <td>255</td> <td>326</td> </tr> <tr> <td>Other Expenses</td> <td>290</td> <td>469</td> <td>455</td> <td>305</td> <td>412</td> <td>464</td> </tr> <tr> <td>Oprating Profit</td> <td>281</td> <td>195</td> <td>269</td> <td>559</td> <td>526</td> <td>575</td> </tr> <tr> <td>OPM %</td> <td>15.87%</td> <td>9.71%</td> <td>10.98%</td> <td>21.32%</td> <td>17.01%</td> <td>15.12%</td> </tr> <tr> <td>Finance Cost</td> <td>24</td> <td>20</td> <td>16</td> <td>11</td> <td>19</td> <td>33</td> </tr> <tr> <td>Depreciation</td> <td>71</td> <td>84</td> <td>103</td> <td>87</td> <td>120</td> <td>152</td> </tr> <tr> <td>Profit Before Tax</td> <td>191</td> <td>91</td> <td>281</td> <td>401</td> <td>507</td> <td>434</td> </tr> <tr> <td>Tax Expenses</td> <td>63</td> <td>29</td> <td>90</td> <td>151</td> <td>162</td> <td>118</td> </tr> <tr> <td>Profit After Tax</td> <td>128</td> <td>62</td> <td>191</td> <td>253</td> <td>347</td> <td>319</td> </tr> <tr> <td>NPM</td> <td>7.23%</td> <td>3.08%</td> <td>7.80%</td> <td>9.64%</td> <td>11.23%</td> <td>8.38%</td> </tr> <tr> <td>EPS</td> <td>39</td> <td>19</td> <td>58</td> <td>77</td> <td>105</td> <td>95</td> </tr> </tbody> </table> </div> The sales of the company have been rising consistently from year 2015 to 2020. The total revenue during the period has surged up to 115% to Rs 3,801 crore from Rs 1,769 crore. The operation profit margin has remained in double digits, barring year 2016. The company has witnessed a consistent rise in Profit after Tax (PAT), which increased up to 150% between 2015 to 2020. The company generated a PAT of Rs 128 in 2015 and Rs 318 in 2020. The net profit margin has remained near double digits during the period under review. <strong>Graphical Representation of Haldiram Snacks Private Limited Financials</strong> <img class="alignnone wp-image-15558" src="https://unlistedzone.com/storage/knowledge-logo/11-3.jpg" alt="" width="530" height="398" /> <img class="alignnone wp-image-15574" src="https://unlistedzone.com/storage/knowledge-logo/12-3.jpg" alt="" width="530" height="397" /><img class="alignnone wp-image-15575" src="https://unlistedzone.com/storage/knowledge-logo/13-3.jpg" alt="" width="530" height="398" /> <img class="alignnone wp-image-15565" src="https://unlistedzone.com/storage/knowledge-logo/14-1.jpg" alt="" width="530" height="397" /> <img class="alignnone wp-image-15566" src="https://unlistedzone.com/storage/knowledge-logo/15-1.jpg" alt="" width="530" height="398" /> <strong>Valuation of Haldiram Group</strong> In 2019, Kellogg had made an interest in the growth story of Haldiram and at that time it was valued at $3Billion of the whole group. However, things didn't work out due to some complications in the business structure of Haldiram and the ongoing dispute in the court. Kolkata Group has taken Delhi and Nagpur entities to the court for the fight of brand ownership and trademark. <a href="https://unlistedzone.com/storage/knowledge-logo/AR-2020-1.pdf">Annual report of Haldiram Snack Private Limited 2020</a> <a href="https://unlistedzone.com/storage/knowledge-logo/AR-2019.pdf">Annual Report of Halidram Snack Private Limited 2019</a> <a href="https://unlistedzone.com/storage/knowledge-logo/AR-2018.pdf">Annual Report of Haldiram Snack Private Limited 2018</a> <a href="https://unlistedzone.com/storage/knowledge-logo/AR-2020-1.pdf">Annual Report of Haldiram Snack Private Limited 2017</a> <a href="https://unlistedzone.com/storage/knowledge-logo/AR-2020-1.pdf">Annual Report of Haldiram Snack Private Limited 2016</a>
<p>HDB Financial Services (HDBFS) is a leading Non-Banking Financial Company (NBFC) that caters to the growing needs of an aspirational India, serving both Retail & Commercial Clients. It is a Systemically Important Non-Deposit taking Non-Banking Financial Company (‘NBFC’). HDFC bank holds 95.1% stakes in this subsidiary.</p> <!--more--> <p><strong>Highlights of the Financial Year</strong> <br /><br />1. HDB Financial loan book stands at Rs.58947 as on 31.03.2021. Last year it was ~Rs.55000 Crores. This shows that HDB financial is very cautious in distributing loans, otherwise, the last 6 years CAGR i.e. from 2014 to 2020 was 26%. This we can understand with COVID-19 making businesses unviable, so giving loan becomes risky. <br /><br />2. HDB Financials has liquidity ratio of 265% and RBI requirement is 100% after April 2021. So, it is sitting at comfortable position. <br /><br />3. PAT has gone down to 502 Crores in FY20-21 as compared to 1036 Crores last year. This has been due to increase in provisioning for bad debts. <br /><br />4. Capital Adequacy Ratio stands at 19% which is well above the RBI guidelines of 15%. <br /><br />5. As on 31.03.2021, the gross NPA stands at 3.9% as compared to 3.5% last year.</p>
<p>HDFC Securities, the flagship company of HDFC Group has come up with the annual results for the FY20-21. In the FY20-21, HDFC Securities has clocked revenue of 1400 crores; it was only 862 crores last year in the same period. This has translated into a massive 60% growth in revenue. Total expenses have also gone up to 453 crores as compared to 353 crores last year in the same period.</p> <!--more--> <p>The main expense of Broking Company is employee salaries, for HDFC Securities it accounted for 17% of total expense in the FY20-21. The PAT has also grown by 83% to reach 700 crores as compared to just 384 crores last year. <br /><br /><strong>Results Snapshot (in Crores)</strong></p> <div class="table-overflow-init"> <table> <tbody> <tr> <td style="width: 12.0846%;" width="79">Date</td> <td style="width: 17.5227%;" width="79">Total Income</td> <td style="width: 19.3353%;" width="82">EBITDA</td> <td style="width: 12.3867%;" width="64">OPM</td> <td style="width: 10.574%;" width="64">PAT</td> <td style="width: 12.3867%;" width="64">NPM</td> <td style="width: 10.2719%;" width="83">EPS</td> </tr> <tr> <td style="width: 12.0846%;">2020</td> <td style="width: 17.5227%;">860</td> <td style="width: 19.3353%;">520</td> <td style="width: 12.3867%;">60%</td> <td style="width: 10.574%;">384</td> <td style="width: 12.3867%;">44%</td> <td style="width: 10.2719%;">245</td> </tr> <tr> <td style="width: 12.0846%;">2021</td> <td style="width: 17.5227%;">1400</td> <td style="width: 19.3353%;">950</td> <td style="width: 12.3867%;">70%</td> <td style="width: 10.574%;">700</td> <td style="width: 12.3867%;">51%</td> <td style="width: 10.2719%;">446</td> </tr> </tbody> </table> </div> <p><strong>Euphoria in the market</strong> <br /><br />If we see the market stats carefully in the FY20-21, retail investors have participated big-time as a trader and investor, both. <br /><br />The WFH has given a lot of retail investors a time to invest in the market. The continuous rise of market is also playing in the mind of investors who are buying stocks as they don't want to miss this opportunity of making easy money. This has resulted into good brokerage income for stock brokers in the market. <br /><br />HDFC Securities has shown very good numbers in the FY20-21 and touched the EPS of 446. This will translate into P/E of 22x at Rs.10,000 per share in the unlisted market. The listed players like Angel Broking and ICICI Securities are trading at P/E of 15x and 11x on the basis of FY20-21 earnings. <br /><br /><a href="https://unlistedzone.com/storage/knowledge-logo/HSL-result.pdf">HDFC Securities Results Link</a> </p>
<div> Despite havoc created by COVID-19 in the year FY20-21, Indofil Industries has achieved a domestic turnover of Rs.1000 Crores. In FY19-20, Indofil had a domestic sales of 910 Crores. This shows that this year they have a growth of 9.8% in the domestic business. Please note, ~45-50% business of the Indofil comes from International market. </div> In FY20-21, they have reduced the debt by ~200 Crores. Last year debt was ~1000 Crores and same has been reduced to ~800 Crores. This year they will achieve ~230 Crores of PAT. This implies that EPS would be somewhere ~100 per share. <!--more--> <strong>About Indofil</strong> Indofil Industries, established in 1965, manufactures crop protection and specialty chemicals, with a turnover of over Rs2,476, has a direct presence in the Indian market through a large sales organization and well spread distribution network .It also has a presence in over 100 countries through direct distributors as well five operating subsidiaries .It derives 50% of its revenue from international business. Indofil has five manufacturing plants supporting its product range, a backward integration through manufacturing joint venture Indobaijin and strong R&D and product management team. <strong>Management changes</strong> <div> The year 2019-20 was also a year of transformation. The demise of the legend and mentor, the Chairman of Modi Enterprises, Shri Krishan Kumar Modi, fondly remembered as KK by many, was a great shock for the Indofil. Dr. Bina Modi now takes over as the new Chairperson of Modi Enterprises. </div>
Private sector unlisted lender, Hero Fincorp, is planning to raise funds via debt. The Hero Group NBFC has tapped capital markets for the purpose. Hero fincorp is expected to expand its loan book across its business verticals. International Finance Corporation (IFC) is planning to invest ~700 Crores in the secured debt of Hero Fincorp, belonging to the Hero Group. Covid-19 pandemic has wreaked havoc on the NBFC sector, which is ailing since the IL&FS crisis. Cash starved companies are constantly raising capital to deploy funds.<!--more--> The company will also deploy three times its loan amount, through its own resources and other sources of funding, towards the same target beneficiaries over the next three years, IFC added. Hero Fincorp is a NBFC firm primarily focussing on two-wheeler (37%) and pre-owned cars financing (7%). Loans to corporates (18%) and micro, small and medium enterprises (21%) also contribute majorly in the company's portfolio. Personal loans (11%) and home loans (6%) contribute to the remaining share. The shareholders of Hero Fincorp include Hero MotorCorp Limited (41.2 per cent), investment companies of the Munjal family (38.3 per cent), Credit Suisse (2 per cent), Chrys Capital (10 per cent) and Apis Growth (2 per cent) and HFCL's dealers/employees (6.5 per cent). The company has been rated as AA+ / stable by rating agencies such as CRISIL and ICRA. The company was launched in 1992 as Hero Honda Finlease. However, restructuring of the joint venture (JV) between Hero Motocorp and Honda Motors, led to renaming of the company as Hero Fincorp. Hero Finocorp brags over its Pan India network providing hassle free loans. It has a distinguished network of up to 950 dealerships available at over 4,000 touch points across 1,900 cities, towns and villages of the country. In FY19-20, Hero-Fin Corp crossed a milestone of covering 50 Lakhs customers, network at 2000 locations, and registered a growth of 40% in loan disbursement compared to previous year. In FY 2019-20, the company clocked total revenue of Rs 3,663 crore, a jump of up to 47% compared to revenue of Rs 2,492 crore during FY 2018-19. The Profit after Tax (PAT) surged 16 per cent Rs 310 crore in FY 2019-20, which was Rs 268 crore in FY 2018-20. The company has managed a revenue of Rs 1,814 crore and PAT of Rs 122 crore till six months ended on September 30, 2020. The company boasts a handsome dividend yield of 25% during the fiscal ending on March 31, 2020, with a net worth of Rs 4,527 crore.
Patanjali Ayurveda (PAL) is an India based consumer and FMCG company, headquartered in Haridwar (Uttrakhand), started by Yog guru Swami Ramdev and Acharya Balkrishna in 2006. The company came into prominence in the early 2010s, when it focused on igniting sentiments of being an 'Indian company' among the customers. Patanjali Ayurveda is a home grown business miracle of sorts with a mission to make India an ideal place for the growth and development of Ayurveda and anything natural for the rest of the world.<!--more--> <strong>History</strong> It is a registered company under the Company’s Act, 1956, having its registered office in New Delhi and its headquarters and manufacturing units located in Haridwar, Uttarakhand. The roots of the establishment date back to 1997, when Baba Ramdev and Acharya Balkrishna started the venture as a small pharmacy in Haridwar. In 2006, Patanjali Ayurveda Limited was established as a private limited company and subsequently converted into a public limited company in 2007, with an objective of establishing the science of Ayurveda in accordance and coordination with the latest technology and ancient wisdom. <strong>Business Model</strong> The company manufactures mineral and herbal products. However, the company has rapidly grown from medicinal and remedy based entity to a leading player in packaged food, water, beverages, pulses, spices, religious, personal care, homecare, dairy and other FMCG products. It also introduced the Coronil kit to cure Covid-19, which leads to controversies. Patanjali most sold product is Cow(Ghee) with sales of <strong>(1467 Crores)</strong>, followed by Toothpaste <strong>(940 Crores)</strong> and them Shampoo <strong>(850 Crores)</strong>. These three products contributes ~35% of the total sales. <img class="alignnone wp-image-15375" src="https://unlistedzone.com/storage/knowledge-logo/Untitled-design.jpg" alt="" width="546" height="410" /> <strong>Advertisement Strategies </strong>Baba Ramdev, a well known and highly acknowledged name in Indian household, led the advertising campaign for the company. For any FMCG company, advertising and promotions typically account for 12–20 percent of revenue expenditure, but this was significantly taken care of by Baba Ramdev’s branded house strategy. A minimal advertising budget which included few commercials and with the employees acting as volunteers in brand promotion aided in cutting down on the advertising and promotion expenditure. All these were attributed to the fact that the company was void of any financial burden. The Patanjali Ayurveda is financially well placed, and the company was started with an investment of Rs 40 Crores, which was initiated by Baba Ramdev from his yoga camps, television shows on private channels, and donations. <strong>Pricing </strong>Baba Ramdev is running Patanjali with a sole objective of providing quality FMCG products with low price as compared to its competitors. Patanjali typically provides products with 10-30% cheaper than competitors. Along with that it has infused spirit in Indian audience to embrace <em>desi </em>products and boycott MNC, who are here only to make profit. <strong>Sales and Distribution</strong> Patanjali Ayurveda sells its products through nearly 5,000 outlets. Patanjali also sells its products online. It has its footprints on some of the railway stations and airports Patanjali Ayurveda has tied up with various retail conglomerates like Pittie Group and Future Group, Reliance Retail, Hyper city. Patanjali Ayurved has also started its FMCG expansion in the form of dealership and distributorship channels across the country and expects wider growth in overseas distribution as well. <strong>Patanjali forced MNC competitors to make Ayurveda Products </strong>Seeing the rapid growth of Patanjali in the Indian FMCG space with its sales touching Rs. 10,000 crore specially around FY16-17, has forced other FMCG brands like Colgate, Nestle, Dabur and Hindustan Unilever rapidly focused on Ayurveda related products. 1. "<em><b>Colgate</b>-Palmolive (India) market share had reduced from 57% in FY14-15 to 53% in FY17-18 due to Baba Ramdev Patanjali resurgence. Due to which they were forced to launch <strong>Vedshakti, an Ayurveda toothpaste, </strong>to counter Baba Ramdev <strong>Dant Kranti.</strong></em> <em>2. Consumer goods major, Hindustan Unilever (HUL) has launched herbal and natural supplements to compete with Baba Ramdev’s Patanjali. </em> However, after 2016-17, the Baba Ramdev was not able to maintain the quality, and has increased pricing of products which has resulted in reduction of sales. Moreover, the other MNC giants have made many changes in their products portfolio as per Ayurveda standards that helped them to regain lost market share. Due to which, Patanjali which was predicting to double its sales to over Rs. 20,000 crore in FY20 from FY16 has only achieved sales of Rs.9000 crore. Patanjali was the fastest growing FMCG company in India. Global brokerages like CLSA And HSBC too attributed the same. In FY 2010-11, the company generated a revenue of Rs 100 crore, which jumped up to 95 times in next 10 years to Rs 9,500 crore in FY 2019-20. Before the current downturn, the Haridwar firm had grown at almost 100 per cent year-on-year between 2014 and 2017. The company had also managed to push its turnover from nearly Rs 2,000 crore in 2014-15 to Rs 5,000 crore in 2015-16 before further doubling it to Rs 10,000 crore in 2016-2017. <strong>Financial Growth</strong> <div class="table-overflow-init"> <table width="100"> <tbody> <tr> <td width="203">Particulars( in Crores)</td> <td width="67">Mar-15</td> <td width="68">Mar-16</td> <td width="68">Mar-17</td> <td width="68">Mar-18</td> <td width="68">Mar-19</td> <td width="68">Mar-20</td> </tr> <tr> <td>Sales</td> <td>2000</td> <td width="68">4,899</td> <td width="68">9,158</td> <td width="68">8,135</td> <td width="68">8,300</td> <td width="68">9,000</td> </tr> <tr> <td>COGS</td> <td>973</td> <td width="68">2,199</td> <td width="68">4,259</td> <td width="68">4,264</td> <td width="68">3,646</td> <td width="68">3,710</td> </tr> <tr> <td>Purchase of stock</td> <td>191</td> <td width="68">740</td> <td width="68">1,705</td> <td width="68">1,642</td> <td width="68">2,673</td> <td width="68">3,508</td> </tr> <tr> <td>Change in Inventory</td> <td>-60</td> <td width="68">-82</td> <td width="68">-115</td> <td width="68">-390</td> <td width="68">46</td> <td width="68">-303</td> </tr> <tr> <td>Employee Benefit Expense</td> <td>74</td> <td width="68">100</td> <td width="68">194</td> <td width="68">261</td> <td width="68">264</td> <td width="68">240</td> </tr> <tr> <td>Other Expense</td> <td>378</td> <td width="68">846</td> <td width="68">1,428</td> <td width="68">1,626</td> <td width="68">1,024</td> <td width="68">896</td> </tr> <tr> <td>Operating Profit</td> <td>444</td> <td width="68">1,096</td> <td width="68">1,687</td> <td width="68">732</td> <td width="68">647</td> <td width="68">949</td> </tr> <tr> <td>OPM %</td> <td>22%</td> <td width="68">22%</td> <td width="68">18%</td> <td width="68">9%</td> <td width="68">8%</td> <td width="68">11%</td> </tr> <tr> <td>Other Income</td> <td>10</td> <td width="68">28</td> <td width="68">26</td> <td width="68">40</td> <td width="68">221</td> <td width="68">65</td> </tr> <tr> <td>Interest</td> <td>15</td> <td width="68">19</td> <td width="68">66</td> <td width="68">180</td> <td width="68">244</td> <td width="68">240</td> </tr> <tr> <td>Depreciation</td> <td>46</td> <td width="68">43</td> <td width="68">69</td> <td width="68">146</td> <td width="68">188</td> <td width="68">197</td> </tr> <tr> <td>Net Profit</td> <td>308</td> <td width="68">777</td> <td width="68">1,193</td> <td width="68">334</td> <td width="68">359</td> <td width="68">424</td> </tr> <tr> <td>No. of shares</td> <td>4.132</td> <td width="68">4.132</td> <td width="68">4.132</td> <td width="68">4.132</td> <td width="68">4.132</td> <td width="68">4.132</td> </tr> <tr> <td>EPS in Rs</td> <td>75</td> <td width="68">188</td> <td width="68">289</td> <td width="68">81</td> <td width="68">87</td> <td width="68">103</td> </tr> </tbody> </table> </div> <strong>Key Financial Ratios</strong> <div class="table-overflow-init"> <table width="100"> <tbody> <tr> <td width="203">Current Ratio</td> <td width="67">1.69</td> <td width="68">1.68</td> <td width="68">1.45</td> <td width="68">1.27</td> <td width="68">1.23</td> <td width="68">1.33</td> </tr> <tr> <td>RONW</td> <td>45%</td> <td>57%</td> <td>46%</td> <td>13%</td> <td>12.00%</td> <td>11.30%</td> </tr> <tr> <td>Free Cash-flow</td> <td>57</td> <td>213</td> <td>-17</td> <td>14</td> <td>500</td> <td>-500</td> </tr> <tr> <td>D/E</td> <td>0.81</td> <td>0.75</td> <td>1.12</td> <td>0.81</td> <td>0.8</td> <td>0.76</td> </tr> <tr> <td>Trade Receivable Days</td> <td>18</td> <td>66</td> <td>78</td> <td>93</td> <td>90</td> <td>86</td> </tr> </tbody> </table> </div> <img class="alignnone wp-image-15380" src="https://unlistedzone.com/storage/knowledge-logo/10-1.jpg" alt="" width="547" height="410" /> <img class="alignnone wp-image-15381" src="https://unlistedzone.com/storage/knowledge-logo/11-1.jpg" alt="" width="548" height="411" /> <img class="alignnone wp-image-15379" src="https://unlistedzone.com/storage/knowledge-logo/12.jpg" alt="" width="546" height="410" /> The company peaked a net profit of Rs 1,1193 crore in FY 2016-17 with an EPS of Rs 289. The net profit of the company declined to Rs 334 crores, Rs 350 crores and Rs 424 crore in next three fiscals, respectively and EPS plunged to Rs 81, 87 and Rs 103 during the periods mentioned above in the same order. <strong>Shareholding Pattern </strong>Acharya Balkrishna holds up to 98.6% stake in Patanjali Ayurveda. According to Forbes, His net worth stood at $2.22 billion (Rs 16,600 crore) as of October 2020. According to Hurun’s Rich List 2021, Balkrishna’s estimated net worth dipped by 32% in last year. <strong>Acquisition</strong> In December 2019, Patanjali acquired bankrupt Ruchi Soya Industries at a valuation of Rs 4,350 crore. It is a major soybean product player in India owing products like Mahakosh and Nutrela. The company was relisted on BSE and NSE. The scrip came in the controversies as it soared up to 8,800% in just six months. This led to the stock put under scrutiny by regulators and media. Ruchi Soya was highly under speculation as promoters held up to 99 per cent stake in the company.
Cafe Coffee Day is facing trouble from the last one year after a suicide of its founder V. G. Siddhartha. Despite reduction of debt from whopping 4000 Crores to 518 Crores which they have achieved by selling assets, CCD defaulted to pay interest and principal on time. The detail of defaults as accessed from BSE is mentioned below.<!--more--> <div class="table-overflow-init"> <table width="100"> <tbody> <tr> <td width="257"><strong>Particulars</strong></td> <td width="203"><strong>Amount (in Crores)</strong></td> </tr> <tr> <td><strong>A) Total Cash credit outstanding</strong></td> <td><strong>280</strong></td> </tr> <tr> <td>Total amount defaulted as on date</td> <td>25</td> </tr> <tr> <td>Default in Interest</td> <td>7.33</td> </tr> <tr> <td><strong>B) Total NCD and NCRPS</strong></td> <td><strong>200</strong></td> </tr> <tr> <td>Total amount outstanding as default</td> <td>200</td> </tr> <tr> <td>Default in Interest</td> <td>30</td> </tr> <tr> <td>Total Short term and Long-term</td> <td>518 Crores</td> </tr> </tbody> </table> </div> As on 06.04.2021, the CCD has to pay (25+7.33+200+30) = 263 Crores of principal and interest to the creditors. However, as their revenue is keep on falling from 4000 Crores in 2018 to ~1400 Crores in 2021 they are not generating any profit from the business at operational level from last 2 years. And, icing on cake is lockdown which is already implemented many places in India directly hampering retail chain outlets. Because of which they are not in position to pay this debt. Now, they will have to find a way by selling more assets to prevent them to go the bankruptcy. <strong>What will happen next?</strong> The creditors will definitely give them some time to pay back the principal and interest and if they fail to do so, creditors can take them to NCLT. So, we need to watch the development in this counter closely to get more insights in future. Stay tuned with us for more such updates.
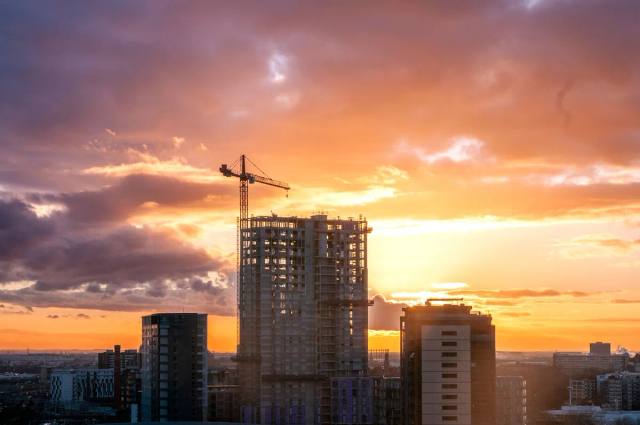
In the EGM to be held on 22.04.2021, Five Star Business is issuing 14,71,771 (Fourteen Lakhs Seventy-One Thousand Seven Hundred and Seventy-One) equity shares of Rs 10/- (Rupees Ten Only) on preferential basis by way of private placement to various investors, the list is mentioned below.<!--more--> <div class="table-overflow-init"> <table width="100"> <tbody> <tr> <td width="206">Name of the Investor</td> <td width="127">No. of shares</td> <td width="117">Premium</td> <td width="168">Money Raised</td> </tr> <tr> <td width="206">Sequoia Capital Global Growth Fund III -Endurance Partners L.P.</td> <td width="127">10,15,729</td> <td width="117">Rs.3508</td> <td width="168">357 Crores</td> </tr> <tr> <td width="206">Norwest Venture Partners X – Mauritius</td> <td width="127">26,741</td> <td width="117">Rs.3508</td> <td width="168">9.50 Crores</td> </tr> <tr> <td width="206">Sirius II Pte. Ltd.</td> <td width="127">1,45,104</td> <td width="117">Rs.3508</td> <td width="168">51 Crores</td> </tr> <tr> <td width="206">TVS Shriram Growth Fund 3</td> <td width="127">2,84,197</td> <td width="117">Rs.3508</td> <td width="168">100 Crores</td> </tr> </tbody> </table> </div> This current raising of funds have valued the Five-Star Business at ~$1.3 Billion. <strong>About Five-Star Business</strong> Formed in the year 1982, Five Star is non-Banking Finance Company (NBFC) with the Reserve Bank of India (RBI), specialized in providing financial services to address the needs of unbanked, and unserved segment, funding the people who were perceived to be non-fundable. The customers include all the way from small shop owners, flower vendors, maids, masons to small and medium enterprises that form the backbone of India’s economy. Five Star provides Small business loans to meet borrower requirements for commencing new businesses, expansion of his/ her existing businesses and to settle any unorganized dues he/ she has taken to further their businesses. The loans are given based on the company’s evaluation of the borrower household cashflows coupled against the security of the borrower’s house collateral. <strong>Financial Performance</strong> <div class="table-overflow-init"> <table width="100"> <tbody> <tr> <td width="130">Particulars (in Crs)</td> <td width="64">Mar-15</td> <td width="64">Mar-16</td> <td width="64">Mar-17</td> <td width="64">Mar-18</td> <td width="64">Mar-19</td> <td width="92">Mar-20</td> </tr> <tr> <td width="130">Revenue</td> <td width="64">33.6</td> <td width="64">46</td> <td width="64">84</td> <td width="64">192</td> <td width="64">389</td> <td width="92">787</td> </tr> <tr> <td width="130">Interest</td> <td width="64">10.3</td> <td width="64">14</td> <td width="64">24</td> <td width="64">57</td> <td width="64">75</td> <td width="92">216</td> </tr> <tr> <td width="130">Employee Cost</td> <td width="64">4.8</td> <td width="64">8</td> <td width="64">20</td> <td width="64">45</td> <td width="64">76</td> <td width="92">127</td> </tr> <tr> <td width="130">Impairment of Assets</td> <td width="64">0</td> <td width="64">0</td> <td width="64">0</td> <td width="64">0</td> <td width="64">7</td> <td width="92">50</td> </tr> <tr> <td width="130">Other Expense</td> <td width="64">2</td> <td width="64">5</td> <td width="64">12</td> <td width="64">25</td> <td width="64">25</td> <td width="92">34</td> </tr> <tr> <td width="130">Finance Profit</td> <td width="64">15</td> <td width="64">19</td> <td width="64">27</td> <td width="64">65</td> <td width="64">206</td> <td width="92">360</td> </tr> <tr> <td width="130">Finance Margins</td> <td width="64">47%</td> <td width="64">42%</td> <td width="64">33%</td> <td width="64">34%</td> <td width="64">52%</td> <td width="92">46%</td> </tr> <tr> <td width="130">Other Income</td> <td width="64">0.6</td> <td width="64">2</td> <td width="64">3</td> <td width="64">16</td> <td width="64">18</td> <td width="92">40</td> </tr> <tr> <td width="130">Depreciation</td> <td width="64">0.36</td> <td width="64">0.5</td> <td width="64">0.9</td> <td width="64">3</td> <td width="64">4</td> <td width="92">10</td> </tr> <tr> <td width="130">Profit before tax</td> <td width="64">16</td> <td width="64">20</td> <td width="64">30</td> <td width="64">78</td> <td width="64">217</td> <td width="92">390</td> </tr> <tr> <td width="130">Tax</td> <td width="64">5</td> <td width="64">7</td> <td width="64">11</td> <td width="64">22</td> <td width="64">62</td> <td width="92">87</td> </tr> <tr> <td width="130">Net Profit</td> <td width="64">10</td> <td width="64">13</td> <td width="64">18</td> <td width="64">55</td> <td width="64">155</td> <td width="92">260</td> </tr> <tr> <td width="130">Shares</td> <td width="64">1.02</td> <td width="64">1.1</td> <td width="64">1.4</td> <td width="64">1.92</td> <td width="64">2.32</td> <td width="92">2.55</td> </tr> <tr> <td width="130">EPS in Rs</td> <td width="64">10</td> <td width="64">12</td> <td width="64">13</td> <td width="64">29</td> <td width="64">65</td> <td width="92">102</td> </tr> </tbody> </table> </div> <a href="https://unlistedzone.com/storage/knowledge-logo/115906_Five-Star_Business_Finance_Limited_Notice_of_the_Extra_Ordinary_General.pdf">EGM Notice</a>
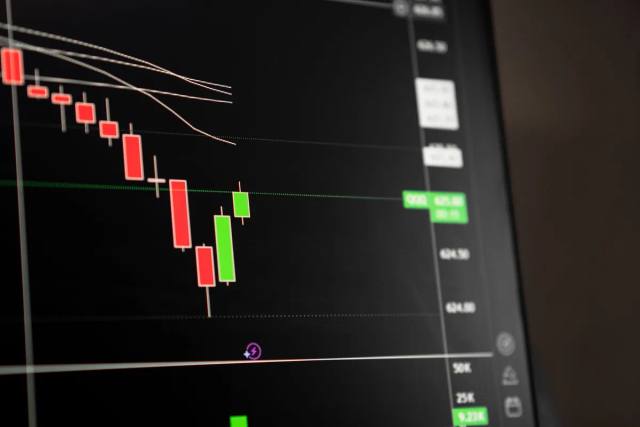
Utkarsh Small Finance Bank has raised Rs.240 Crores via Private Placement from various investors, the list is mentioned below. 1. Olympus ACF Pte. = 3.704 crores shares 2. Responsibility Participations Mauritius = 1.344 Crores shares 3. Aavishkaar Bharat Fund = 1.296 Crores shares 4. Triodos Sicav II - Triodos Microfinance Fund = 0.854 Crores shares 5. Legal Owner Triodos Funds B.V = 0.854 Crores shares 6. Growth Catalyst Partners LLC. = 0.854 Crores shares So, total 8.906 Crores shares were issued to the investors for Rs.240 Crores. It means the shares are issued at ~27 per share.<!--more--> <strong>Valuation of Utkarsh Small Finance Bank</strong> As on 31.03.2020, the total shares outstanding were 75.93 Crores and having Net-worth of 1019 Crores. Therefore, the Book value was 13.42x. After the deal, the number of shares outstanding are (75.93+8.906)= 84.836 Crores and Net-worth (1019+240)= 1259 Crores. Therefore, the Book value post this transaction is 14.85x. They raised money at Rs.27 per share, so P/B is 1.81x. <strong>Utkarsh Microfinance vs Utkarsh Small Finance Bank</strong> In the unlisted market, share of Utkarsh Microfinance is available which is the holding company of Utkarsh Small Finance Bank. However, before the IPO, the shareholders of Utkarsh Microfinance will get 8 share for Utkarsh Small Finance bank for every 1 shares of Utkarsh Microfinance. Currently, the Utkarsh Microfinance is available at Rs.220-230 per share in the unlisted market, which translate into price of 27.5-28.85 for Utkarsh Small Finance Bank. <strong>IPO News</strong> Utkarsh Small Finance Bank has already filed a DRHP on 06.03.2021 to SEBI for IPO approval. <strong>About Utkarsh Small Finance Bank</strong> Utkarsh Small Finance Bank offers a gamut of Banking products & services which also includes Micro, Small and Medium Enterprise (MSME) Loans, Housing Loans (HL), Wholesale Lending, Deposit Accounts (CASA, FD & RD), Insurance, Mutual Funds, Remittances, Institutional, Government and TASC services. Utkarsh also offers a wide range of payment services which include Debit Cards, ATMs, POS Payments, Digital offerings like Internet Banking, Mobile Banking, and payments through NEFT, RTGS, and IMPS. <strong>Headquarter</strong> Varanasi, Uttar Pradesh Utkarsh Small Finance Bank has operations in Bihar, Chhattisgarh, Delhi-NCR, Haryana, and Himachal Pradesh Jharkhand, Madhya Pradesh, Maharashtra, Uttar Pradesh, Uttarakhand, and West Bengal. <strong>Financial of Utkarsh Small Finance Bank:</strong> <table width="100%"> <tbody> <tr> <td>Particulars (In Crores)</td> <td>FY19-20</td> <td>FY18-19</td> <td>FY 17-18</td> <td>FY 16-17</td> </tr> <tr> <td>Net Worth</td> <td>1019</td> <td>772</td> <td>411</td> <td>304.9</td> </tr> <tr> <td>Deposits</td> <td>5235</td> <td>3791</td> <td>2,193.70</td> <td>18.7</td> </tr> <tr> <td>Borrowing</td> <td>2675</td> <td>1492</td> <td>1,788</td> <td>2,288</td> </tr> </tbody> </table> <table width="100%"> <tbody> <tr> <td>Particulars (In Crs)</td> <td>FY19-20</td> <td>FY18-19</td> <td>FY 17-18</td> <td>FY 16-17</td> </tr> <tr> <td>Interest Income</td> <td>1307</td> <td>879</td> <td>519</td> <td>72</td> </tr> <tr> <td>Interest Expense</td> <td>579</td> <td>381</td> <td>250.7</td> <td>44.3</td> </tr> <tr> <td>Net Interest Income</td> <td>728</td> <td>498</td> <td>268.3</td> <td>27.7</td> </tr> <tr> <td>Other Income</td> <td>98</td> <td>59.8</td> <td>42.3</td> <td>17.7</td> </tr> <tr> <td>Total Income</td> <td>1406</td> <td>939</td> <td>310.6</td> <td>45.4</td> </tr> <tr> <td>Operating profit</td> <td>350</td> <td>230</td> <td>75.5</td> <td>10.5</td> </tr> <tr> <td>Provisioning Write off</td> <td>99</td> <td>136</td> <td>170.4</td> <td>4</td> </tr> <tr> <td>PAT</td> <td>186</td> <td>93</td> <td>-63</td> <td>4.8</td> </tr> </tbody> </table>
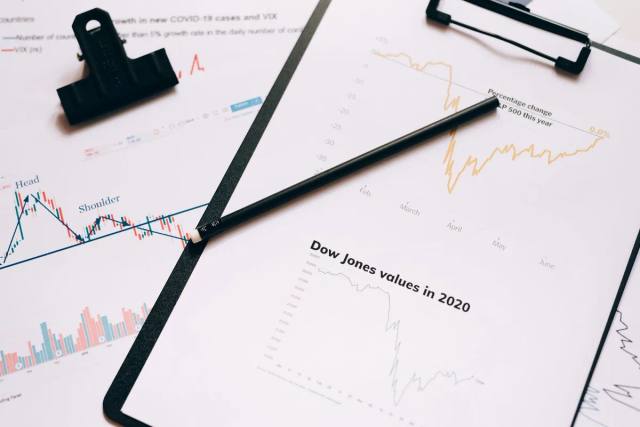
Financial backers in non-bank moneylender Five Star Business Finance are in talks for an auxiliary offer deal, esteeming the organization at $1.2-1.3 billion (Rs 9,000 crore) and making it India's new unicorn. Existing financial backer Morgan Stanley Private Equity could sell a piece of its stake for near $100 million to Sequoia Capital's Global Growth Fund, a $8 billion venture vehicle intended to back the best organizations from its portfolio around the world, said these individuals, who mentioned secrecy. Sequoia India is now a financial backer in Five Star. <!--more-->Five Star, which gives tied down advances to independent companies, additionally checks Matrix Partners, Norwest Venture Partners and private value goliath TPG as its financial backers. It was esteemed at $950 million in July 2019, when TPG drove a $50 million round. Sequoia declined to remark while Five Star and Morgan Stanley didn't react to messages looking for input. <strong>Source:</strong><em><strong> Moneycontrol</strong></em> <strong>About Company</strong> Formed in the year 1982, Five Star is non-Banking Finance Company (NBFC) with the Reserve Bank of India (RBI), specialized in providing financial services to address the needs of unbanked, and unserved segment, funding the people who were perceived to be non-fundable. The customers include all the way from small shop owners, flower vendors, maids, masons to small and medium enterprises that form the backbone of India’s economy. <strong>Financials</strong> <table width="100"> <tbody> <tr> <td width="130">Particulars (in Crs)</td> <td width="64">Mar-15</td> <td width="64">Mar-16</td> <td width="64">Mar-17</td> <td width="64">Mar-18</td> <td width="64">Mar-19</td> <td width="92">Mar-20</td> </tr> <tr> <td width="130">Revenue</td> <td width="64">33.6</td> <td width="64">46</td> <td width="64">84</td> <td width="64">192</td> <td width="64">389</td> <td width="92">787</td> </tr> <tr> <td width="130">Interest</td> <td width="64">10.3</td> <td width="64">14</td> <td width="64">24</td> <td width="64">57</td> <td width="64">75</td> <td width="92">216</td> </tr> <tr> <td width="130">Employee Cost</td> <td width="64">4.8</td> <td width="64">8</td> <td width="64">20</td> <td width="64">45</td> <td width="64">76</td> <td width="92">127</td> </tr> <tr> <td width="130">Impairment of Assets</td> <td width="64">0</td> <td width="64">0</td> <td width="64">0</td> <td width="64">0</td> <td width="64">7</td> <td width="92">50</td> </tr> <tr> <td width="130">Other Expense</td> <td width="64">2</td> <td width="64">5</td> <td width="64">12</td> <td width="64">25</td> <td width="64">25</td> <td width="92">34</td> </tr> <tr> <td width="130">Finance Profit</td> <td width="64">15</td> <td width="64">19</td> <td width="64">27</td> <td width="64">65</td> <td width="64">206</td> <td width="92">360</td> </tr> <tr> <td width="130">Finance Margins</td> <td width="64">47%</td> <td width="64">42%</td> <td width="64">33%</td> <td width="64">34%</td> <td width="64">52%</td> <td width="92">46%</td> </tr> <tr> <td width="130">Other Income</td> <td width="64">0.6</td> <td width="64">2</td> <td width="64">3</td> <td width="64">16</td> <td width="64">18</td> <td width="92">40</td> </tr> <tr> <td width="130">Depreciation</td> <td width="64">0.36</td> <td width="64">0.5</td> <td width="64">0.9</td> <td width="64">3</td> <td width="64">4</td> <td width="92">10</td> </tr> <tr> <td width="130">Profit before tax</td> <td width="64">16</td> <td width="64">20</td> <td width="64">30</td> <td width="64">78</td> <td width="64">217</td> <td width="92">390</td> </tr> <tr> <td width="130">Tax</td> <td width="64">5</td> <td width="64">7</td> <td width="64">11</td> <td width="64">22</td> <td width="64">62</td> <td width="92">87</td> </tr> <tr> <td width="130">Net Profit</td> <td width="64">10</td> <td width="64">13</td> <td width="64">18</td> <td width="64">55</td> <td width="64">155</td> <td width="92">260</td> </tr> <tr> <td width="130">Shares</td> <td width="64">1.02</td> <td width="64">1.1</td> <td width="64">1.4</td> <td width="64">1.92</td> <td width="64">2.32</td> <td width="92">2.55</td> </tr> <tr> <td width="130">EPS in Rs</td> <td width="64">10</td> <td width="64">12</td> <td width="64">13</td> <td width="64">29</td> <td width="64">65</td> <td width="92">102</td> </tr> </tbody> </table>
Indicative prices, company research and your enquiries — in your pocket. Get price notes on the names you follow and reach our team from anywhere.