Company Overview
Signify Innovations (earlier known as Philips Lighting) has been an industry leader for over a century. The company has consistently pioneered lighting solutions that go beyond simple illumination. Today, it focuses on connected lighting, energy-efficient LEDs, and the digital integration of lighting systems across homes, offices, and cities. With this shift, Signify is not just a lighting company but a digital solutions provider that connects people, devices, and environments.
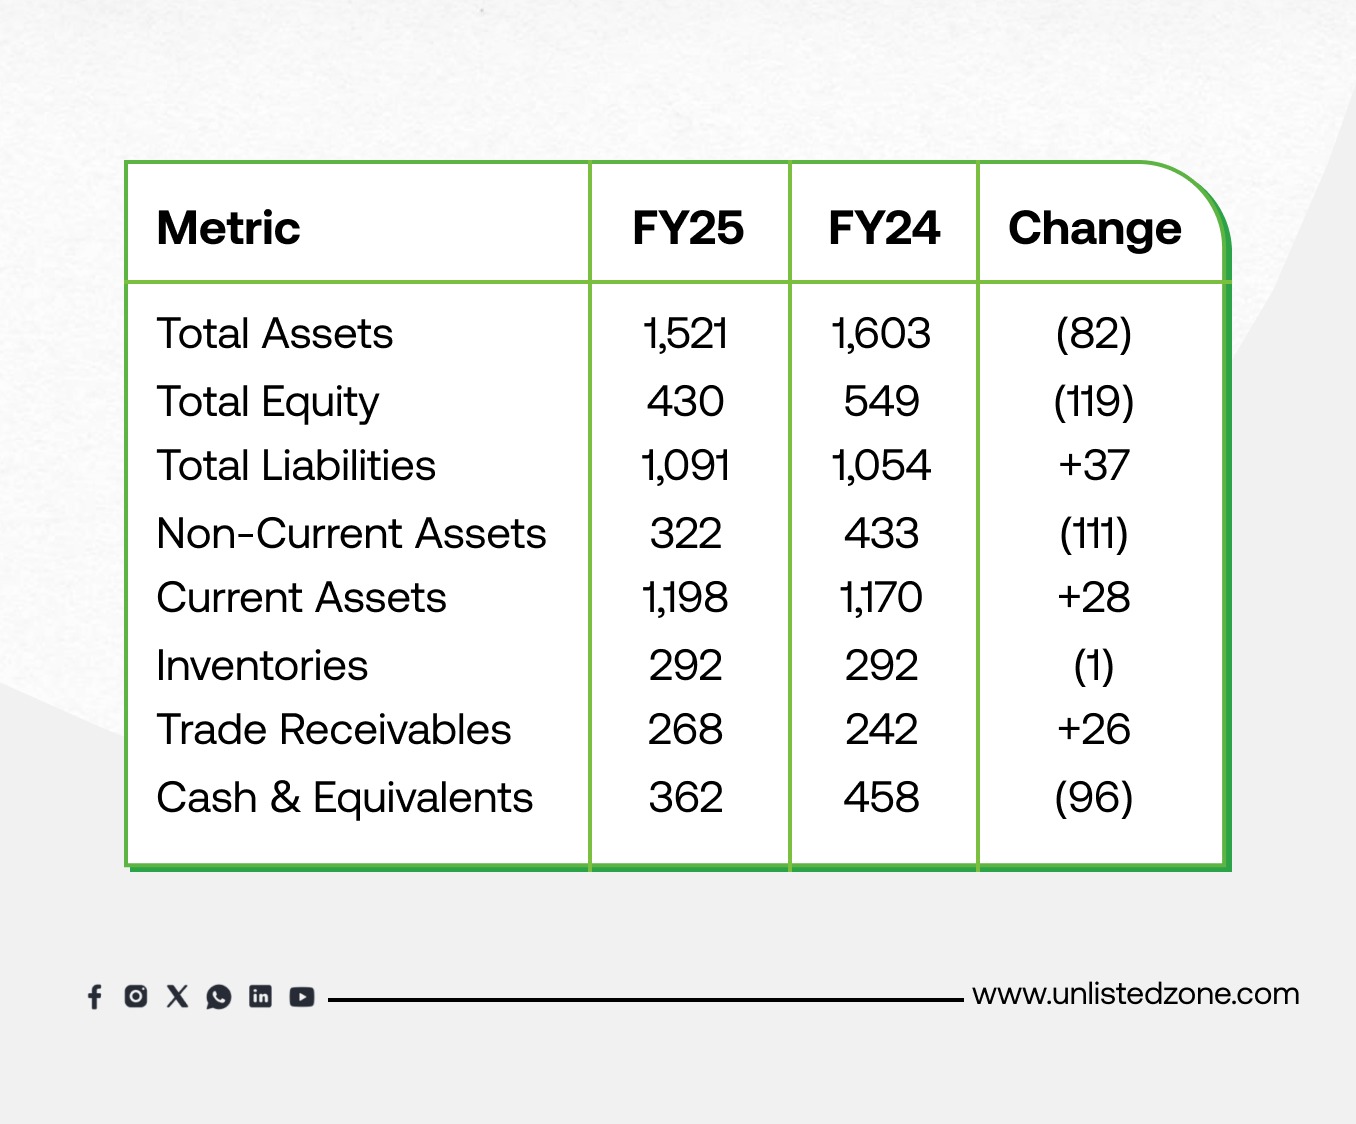
A) Balance Sheet Analysis (₹ Crore)
-
Total Assets declined by ₹82 crore, largely due to a sharp fall in non-current assets, especially financial assets and property, plant & equipment. This signals asset rationalization or possible divestments.
-
Equity fell by ₹119 crore, highlighting higher dividend payouts and reduced reserves.
-
Liabilities rose slightly, with current liabilities up by ₹46 crore, reflecting increased operational borrowings and trade payables.
-
Cash Reserves dropped significantly from ₹458 crore to ₹362 crore, indicating higher outflows despite strong operating cash generation.
-
Notably, assets worth ₹106 crore and liabilities of ₹35 crore were classified as “held for sale,” which suggests restructuring or planned divestment of certain units.
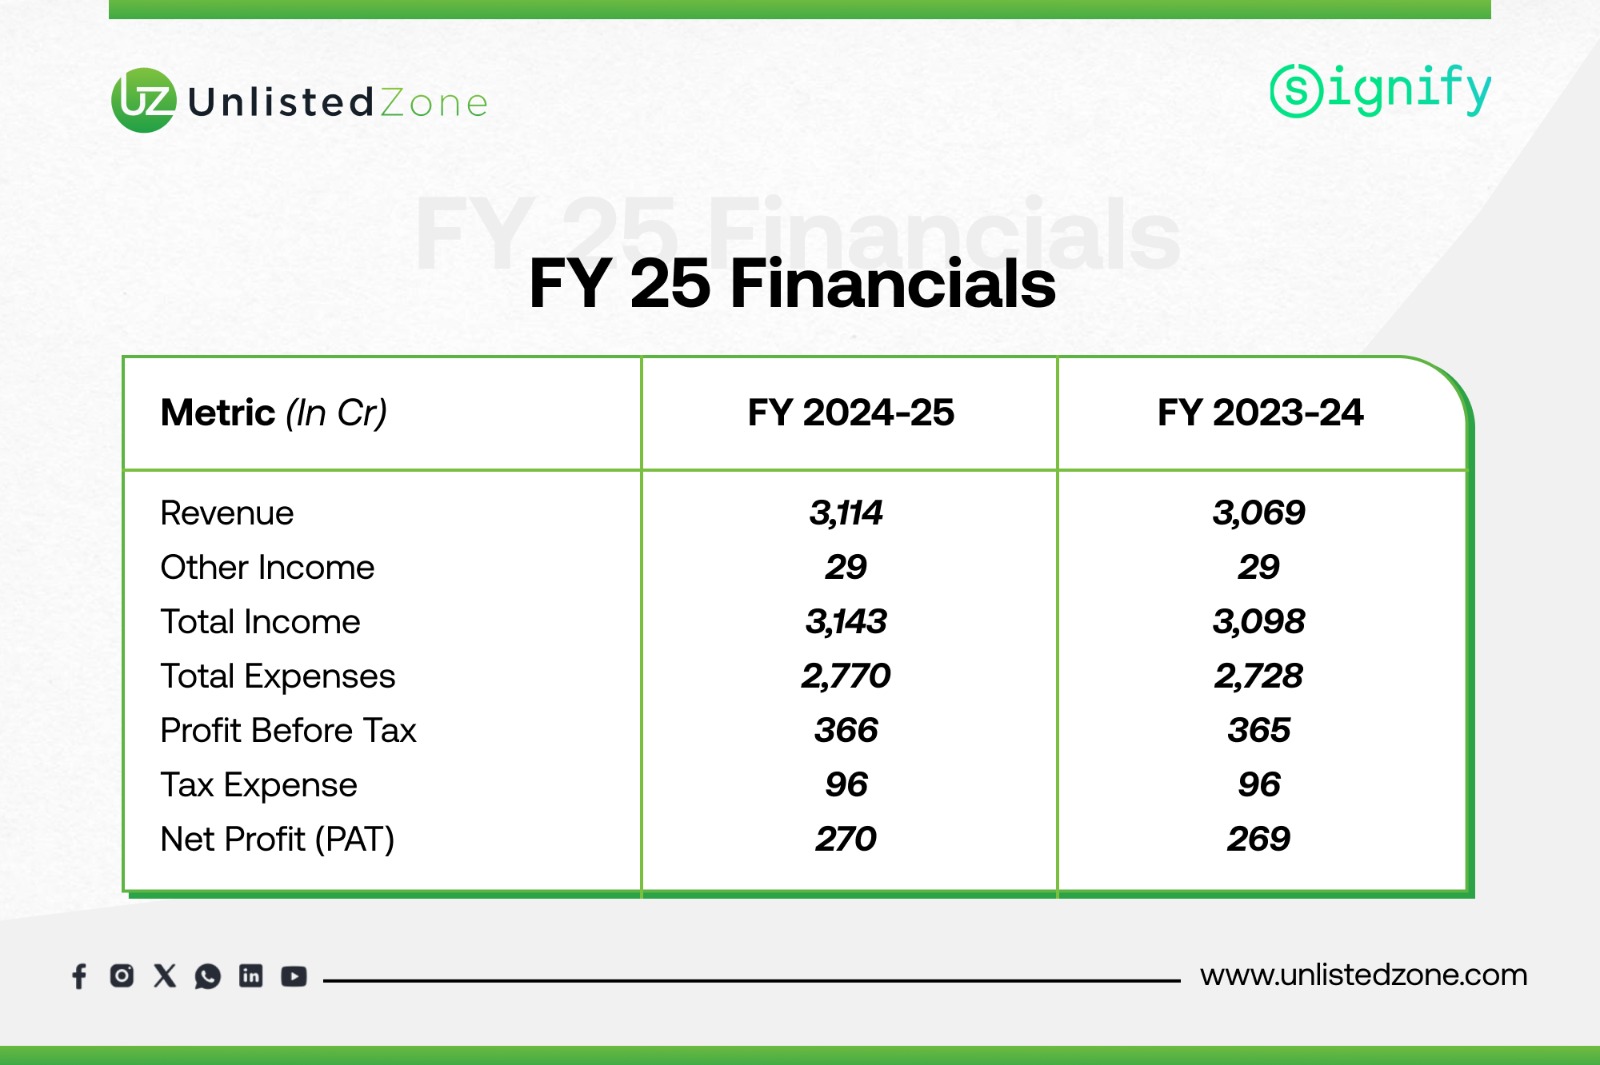
B) Profit & Loss Performance (₹ Crore)
-
Revenue grew by 1% YoY to ₹3,114 crore, showing stability despite macroeconomic challenges.
-
Expenses increased marginally, driven by raw material costs (₹334 crore vs ₹228 crore in FY24) and higher employee expenses (₹626 crore vs ₹577 crore in FY24). However, a reduction in traded goods purchases and controlled overheads helped offset the cost surge.
-
PAT remained steady at ₹270 crore, showcasing resilience in profitability.
-
Margins were well managed, with PAT margins at 8.7%, only marginally lower than last year’s 8.8%. This demonstrates consistent operational efficiency.
Why Signify (Philips Lighting) Revenue Isn't Growing Significantly
-
Severe Price Competition: The LED lighting market has become a commodity business. This means products are largely the same, so companies compete mostly on price, destroying profit and revenue value.
-
Cheap Alternatives: The market is flooded with low-cost, non-branded products from the unorganized sector and imports. Price-sensitive customers choose these over branded products like Philips.
-
Decline of Old Technology: Revenue from the conventional lighting business (like CFL bulbs) is falling rapidly as everyone switches to LEDs. This decline offsets growth in other areas.
-
Market Saturation: The initial wave of consumers replacing all their old lights with basic LEDs is over. The market is now highly competitive with lower margins.
In short: The core business of selling basic lights is shrinking due to price wars and competition. Their modest 1.5% growth only came from their new, high-value services and smart lighting products, which were just enough to balance out the decline.
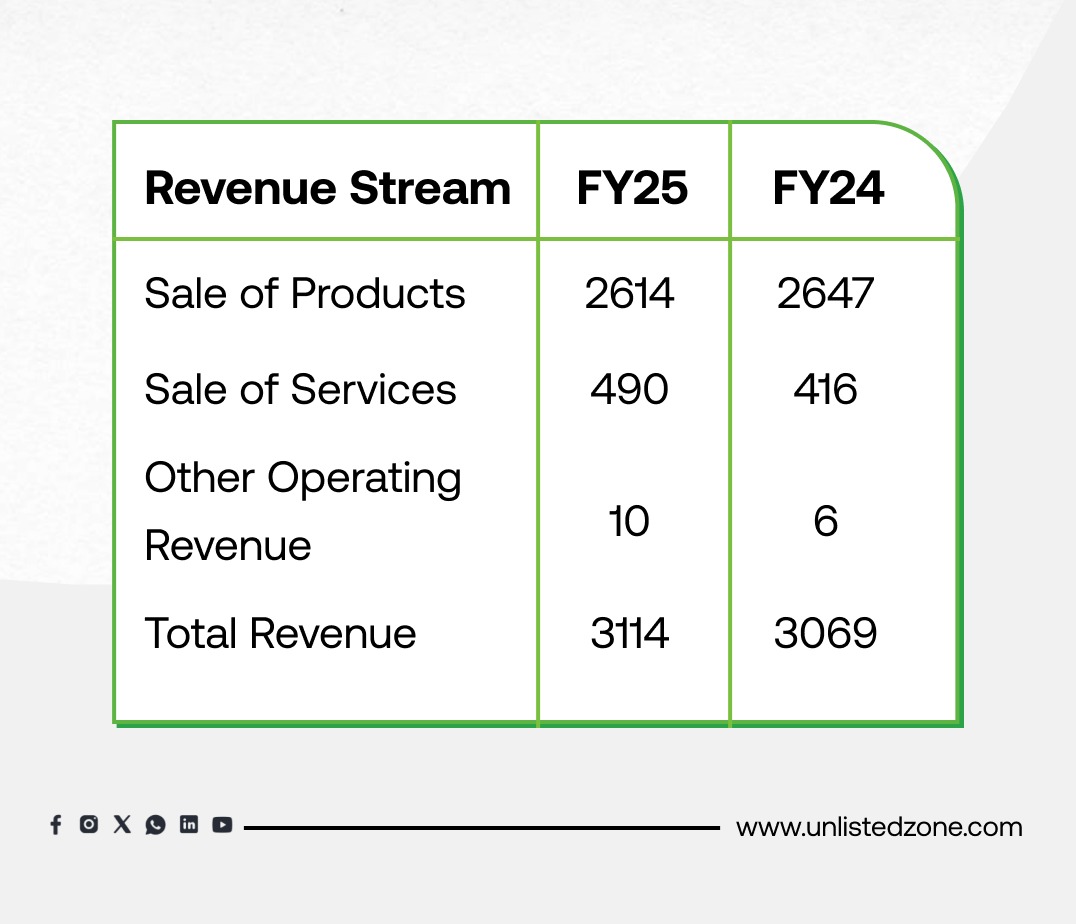
Revenue Breakdown by Contract Type (In crore)
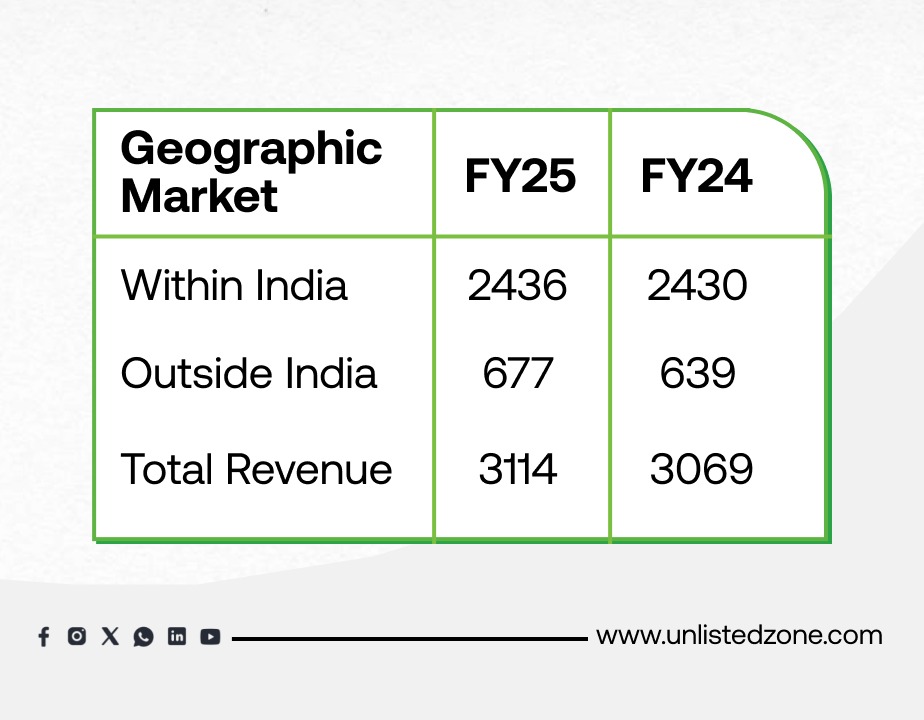
Revenue Breakdown by Geography (In Crore)
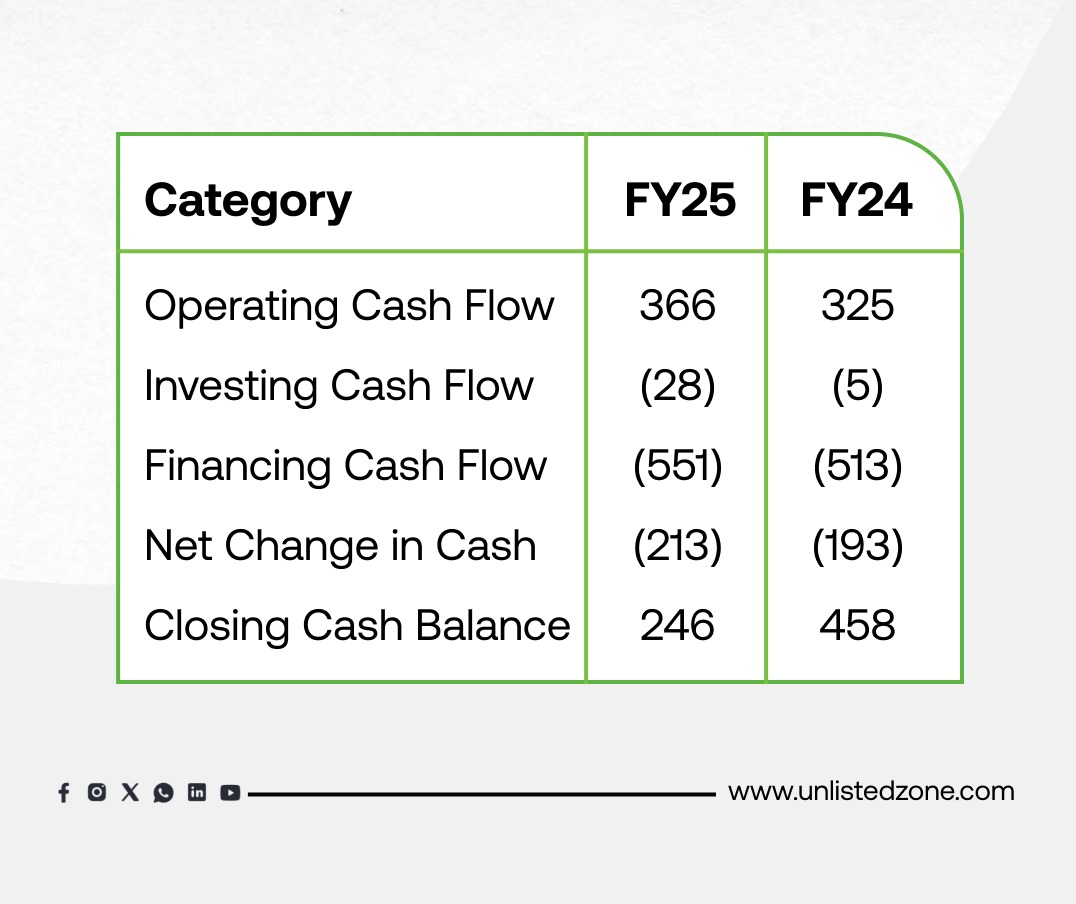
C) Cash Flow Analysis (₹ Crore)
-
Operating Cash Flow rose to ₹366 crore from ₹325 crore, driven by better working capital management. This reflects strong underlying cash generation capacity.
-
Investing Activities saw higher outflows at ₹28 crore due to capex and limited asset sales.
-
Financing Activities had the biggest impact: dividend payouts surged to ₹388 crore (from ₹360 crore in FY24), and lease/interest payments also increased. This resulted in heavy outflows, pulling down cash balances.
-
The net cash decline of ₹213 crore highlights that although the company generates healthy operating cash, aggressive capital distribution and liabilities management weigh on reserves.
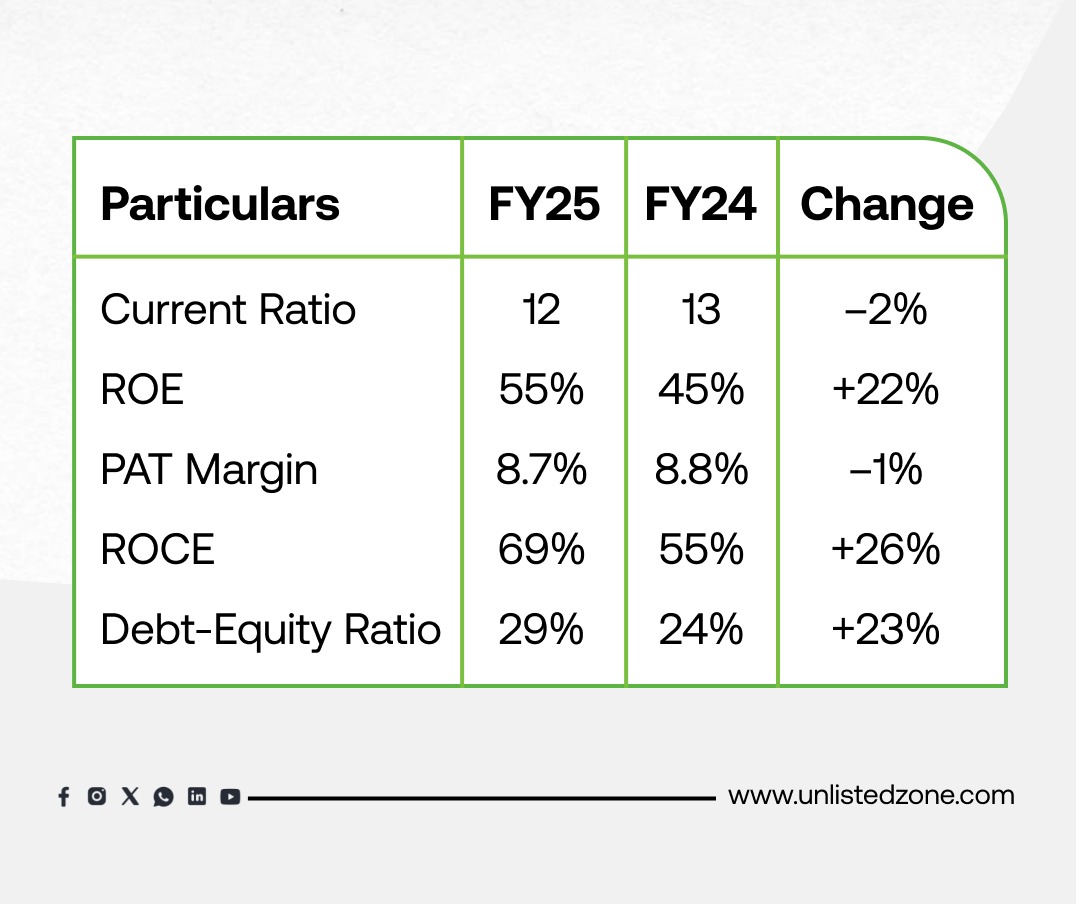
D) Ratio Analysis
-
ROE (55%) surged significantly, driven by stable profits on a smaller equity base (due to high dividends). This indicates attractive returns for shareholders but also shows reduced reinvestment into the business.
-
ROCE (69%) further underscores efficient capital deployment, making Signify one of the stronger performers in its segment.
-
Debt-Equity Ratio increased from 24% to 29%, a manageable level but indicative of rising leverage.
-
Liquidity Position remains robust with a current ratio of 12, suggesting a strong buffer to meet short-term obligations.
Valuation Insights and Unlisted Market History
Current Price : 1275
M.Cap: 7333 Cr
P/E : 27.2x
Interpretation : The valuation at 27x p/e looks high considering there is no growth in the business from last 3 Years.
Unlisted Price Journey
-
2021:
-
2022:
-
2023:
-
2024:
-
2025:
Conclusion
Signify Innovations India Limited delivered a steady FY25 performance with stable revenue, resilient profitability, and strong returns on capital. The company’s ability to maintain PAT at ₹270 crore despite higher input costs demonstrates effective cost management. Cash flows from operations remain strong, though aggressive dividend payouts and liabilities management have reduced reserves.
From an investor’s perspective, the company stands out due to:
-
Strong ROE and ROCE showcasing profitability and efficiency.
-
Stable PAT margins despite inflationary pressures.
-
Robust liquidity position, even with declining cash reserves.
However, rising leverage and continuous depletion of equity through dividends could be areas of caution. In the long run, Signify’s focus on connected and digital lighting solutions, coupled with its innovation-driven approach, positions it well for growth in both consumer and professional lighting markets.
Overall, Signify Innovations remains a solid player in the unlisted market, balancing steady financial performance with promising future potential.
For more Information Visit : UnlistedZone
Disclaimer:
UnlistedZone is not a SEBI-registered Research Analyst or Investment Advisor. All information provided on our platform is strictly for educational and informational purposes. We do not offer investment advice or stock recommendations. Investors are advised to conduct their own due diligence or consult a SEBI-registered advisor. Investments in unlisted and pre-IPO shares are subject to market risks including illiquidity and volatility. UnlistedZone does not assure any returns or accept liability for investment outcomes based on this report.