Blogs, insights, guides and videos on India's unlisted market — all in one place.

<strong>Gross Direct Premium</strong> Q4FY23 witnessed a significant increase in gross direct premium, reaching ₹1,495.46 Cr compared to ₹1,250.77 Cr in Q3FY23. The growth trend is also reflected in the yearly figures, as the gross direct premium for FY23 reached ₹5,141.52 Cr, a substantial increase from ₹3,880.91 Cr in FY22. This indicates a healthy growth trajectory in generating premium revenue for Care Health Insurance. <strong>Net Earned Premium</strong> The net earned premium also experienced a positive trend in Q4FY23, reaching ₹1,201.59 Cr, up from ₹969.61 Cr in Q3FY23. Similarly, the net earned premium for FY23 increased to ₹3,932.04 Cr, compared to ₹2,510.84 Cr in FY22. This signifies an expansion in the company's revenue after accounting for policy cancellations, reinsurance, and other related expenses. <strong>Operating Profit</strong> Q4FY23 witnessed a substantial rise in operating profit, reaching ₹519.27 Cr, compared to ₹47.20 Cr in Q3FY23. The yearly operating profit also increased significantly, with FY23 reporting ₹643.72 Cr, up from ₹282.97 Cr in FY22. This indicates improved operational efficiency and cost management, leading to higher profitability for Care Health Insurance. <strong>Net Profit</strong> The net profit for Q4FY23 stood at ₹99.27 Cr, representing an increase from ₹56.84 Cr in Q3FY23. The yearly net profit for FY23 reached ₹245.84 Cr, a substantial improvement compared to ₹11.50 Cr in FY22. This demonstrates strong profitability and financial performance, indicating effective revenue generation and cost control measures. <strong>Total Net Worth</strong> Care Health Insurance's total net worth increased from ₹1,289.20 Cr in FY22 to ₹1,749.17 Cr in FY23. This growth in net worth reflects the company's strengthened financial position and enhanced capital base, providing a solid foundation for future operations and expansion. <strong>Earnings Per Share (EPS)</strong> Q4FY23 reported an EPS of ₹1.05, an improvement from ₹0.60 in Q3FY23. The yearly EPS for FY23 stood at ₹2.61, reflecting substantial growth compared to ₹0.13 in FY22. This indicates increased earnings available to shareholders for each outstanding share, highlighting the company's profitability and potential return on investment. Overall, Care Health Insurance has demonstrated impressive financial performance in Q4FY23 and throughout FY23. The company exhibited substantial growth in premium revenue, net profit, operating profit, and EPS. Moreover, the significant increase in total net worth signifies a strengthened financial position. These positive indicators suggest effective business strategies, robust operational performance, and enhanced market presence for Care Health Insurance. <strong>Current Valuation:</strong> <table dir="ltr" border="1" cellspacing="0" cellpadding="0"><colgroup> <col width="100" /> <col width="100" /> <col width="100" /></colgroup> <tbody> <tr> <td style="text-align: center;" data-sheets-value="{"1":2,"2":"Particulars"}">Particulars</td> <td style="text-align: center;" data-sheets-value="{"1":2,"2":"Care Health"}">Care Health</td> <td style="text-align: center;" data-sheets-value="{"1":2,"2":"Star Health"}">Star Health</td> </tr> <tr> <td style="text-align: center;" data-sheets-value="{"1":2,"2":"Share Price"}">Share Price</td> <td style="text-align: center;" data-sheets-value="{"1":2,"2":"Rs. 150"}">Rs. 150</td> <td style="text-align: center;" data-sheets-value="{"1":2,"2":"Rs. 590"}">Rs. 590</td> </tr> <tr> <td style="text-align: center;" data-sheets-value="{"1":2,"2":"Shares Outstanding"}">Shares Outstanding</td> <td style="text-align: center;" data-sheets-value="{"1":2,"2":"~94 Crores"}">~94 Crores</td> <td style="text-align: center;" data-sheets-value="{"1":2,"2":"~58.2 Crores"}">~58.2 Crores</td> </tr> <tr> <td style="text-align: center;" data-sheets-value="{"1":2,"2":"Mcap (Market Capitalization)"}">Mcap (Market Capitalization)</td> <td style="text-align: center;" data-sheets-value="{"1":2,"2":"~14000 Crores"}">~14000 Crores</td> <td style="text-align: center;" data-sheets-value="{"1":2,"2":"~34308 Crores"}">~34308 Crores</td> </tr> <tr> <td style="text-align: center;" data-sheets-value="{"1":2,"2":"GWP (Gross Written Premium)"}">GWP (Gross Written Premium)</td> <td style="text-align: center;" data-sheets-value="{"1":2,"2":"Rs. 5141 Crores"}">Rs. 5141 Crores</td> <td style="text-align: center;" data-sheets-value="{"1":2,"2":"~11000 Crores"}">~11000 Crores</td> </tr> <tr> <td style="text-align: center;" data-sheets-value="{"1":2,"2":"Mcap/GWP Ratio"}">Mcap/GWP Ratio</td> <td style="text-align: center;" data-sheets-value="{"1":2,"2":"2.74x"}">2.74x</td> <td style="text-align: center;" data-sheets-value="{"1":2,"2":"3.11x"}">3.11x</td> </tr> </tbody> </table> Care Health still has a share price of Rs. 150 and approximately 94 Crores shares outstanding, resulting in a market capitalization of approximately 14,000 Crores. The Gross Written Premium (GWP) for Care Health remains at Rs. 5,141 Crores. The Mcap/GWP ratio for Care Health is calculated as 2.74x. As for Star Health, the share price is available at as Rs. 590 per share as on 15.05.2023, with a total of approximately 58.2 Crores shares outstanding. This results in a market capitalization of around 34,308 Crores. The GWP for Star Health remains at approximately 11,000 Crores. The Mcap/GWP ratio for Star Health is calculated as 3.11x. Comparing these figures, Care Health still appears to be relatively more reasonably priced than Star Health, as it maintains a lower Mcap/GWP ratio (2.74x compared to 3.11x). This indicates that Care Health's market capitalization is relatively more favorable in relation to its Gross Written Premium, when compared to Star Health. https://unlistedzone.com/shares/care-health-previously-religare-health-insurance-company-limited-unlisted-shares-buy-sell-share-price/
<p>Global Investors Mark Down PharmEasy Valuation Amid Financial Struggles and Broader Tech Downturn <br /><br /><strong>1. Markdown in PharmEasy's Valuation:</strong> <br /><br />According to regulatory filings with the US Securities and Exchange Commission (SEC), API Holdings, the parent company of Mumbai-based online pharmacy PharmEasy, has seen a significant markdown in valuation by funds managed by global asset management company Janus Henderson. <br /><br /><strong>2. Significant Valuation Reduction:</strong> <br /><br />Janus Henderson, which acquired a share in PharmEasy in September 2021, has cut its stake in the company in half, resulting in an estimated valuation of roughly $2.8 billion as of December 31, 2022. <br /><br /><strong>3.</strong> Previously, Neuberger Berman, a New York-based investment management business, had decreased PharmEasy's valuation by 21% to $4.4 billion as of February 28, compared to its previous fundraise valuation. <br /><br /><strong>4. Trend in the Technology Sector:</strong> <br /><br />This is not an isolated event. Other large tech firms, such as Byju's, Swiggy, Pine Labs, and Ola, have seen their investors reduce their valuations. 5. PharmEasy, which is backed by Temasek, was valued at $5.6 billion during its most recent funding round in October 2021, when it raised almost $350 million from investors including Singapore's Amansa Capital, Blackstone-backed hedge fund ApaH Capital, and Janus Henderson. Its valuation increased significantly from $1.5 billion in April 2021 to $5.6 billion. <br /><br /><strong>6. Valuation Markdowns in the Indian Market:</strong> <br /><br />In a sluggish macroeconomic environment, the consumer Internet investment ecosystem in India has seen a series of valuation markdowns by US institutional investors, which could be attributed to a variety of factors such as layoffs, holding back on investments, and broader cost-cutting. <br /><br /><strong>7.</strong> While markdowns are now hypothetical, they may foreshadow a trend in which companies may raise capital at lower valuations in the future. <br /><br /><strong>8. Cash Flow Issues and a Postponed IPO:</strong> <br /><br />PharmEasy postponed its IPO last year and has been trying to raise new capital in the midst of a larger tech slowdown. According to an ET article, PharmEasy's cash runway has reduced to around a year based on its December burn rate, raising questions about the company's long-term viability. <br /><br /><strong>9. Financial Health of the Company:</strong> <br /><br />As of December 2022, PharmEasy has a revenue of Rs 5,200 crore and a cash burn of Rs 30 crore each month. However, the company managed to cut its cash burn in January to Rs 15 crore, demonstrating a desire to improve its financial status. Finally, the decrease in PharmEasy's valuation reflects a broader trend in the tech sector, which could be attributed to a sluggish macroeconomic climate and the company's financial issues. It could also indicate a future trend of entrepreneurs raising money at lower values. <br /><br /><a href="https://unlistedzone.com/shares/pharmeasy-share-price-unlisted-2022/">https://unlistedzone.com/shares/pharmeasy-share-price-unlisted-2022/</a></p>

<p>As an investor looking to <a href="https://unlistedzone.com/shares/">diversify your portfolio</a>, unlisted shares may seem like an attractive option. However, it's important to be aware of the potential risks involved. <br /><br />At UnlistedZone, we want to make sure that our investors are fully informed before making any investment decisions. Here are some of the risks you need to be aware of when investing in unlisted shares: <br /><br /><strong>1. Limited Liquidity</strong> <br /><br />Unlike listed shares, unlisted shares are often traded in low volume, with most of the shares held by promoters or long-term investors. This limited supply of shares makes manipulation of the stock price easier, and can lead to issues when it comes time to sell your shares. At UnlistedZone, we only invest in stocks where the fundamentals are excellent and liquidity is good. This ensures that our investors can sell their shares when they need to without facing any issues. <br /><br /><strong>2. Lack of Transparency <br /><br /></strong> In the listed space, companies are required to report their quarterly results and notify exchanges of any major events that may affect the stock price. However, this level of transparency is not always present in the unlisted space. In many cases, we only receive information about a company's performance at the end of the year, making it difficult to know how the company is performing. At UnlistedZone, we provide our investors with regular updates via our website and weekly newsletter, ensuring that they have access to the latest information about upcoming events, results, and other important information. <br /><br /><strong>3. Higher Risk of Fraud</strong> <br /><br />Unfortunately, there are many fraudulent dealers in the market who are looking to take advantage of investors. They may offer unlisted shares at a lower price than other dealers, but then fail to deliver the shares at all. This can result in investors losing their entire investment. At UnlistedZone, we only work with trusted unlisted dealers who have a track record of delivering on their promises. Over the past 5 years, we've completed transactions worth over 300+ crore without any issues to our investors.<br /><br /><strong>4. Valuation</strong> <br /><br />One of the common risks in the unlisted market is the selling of unlisted shares at very high prices. Fraudulent dealers may sell shares at inflated valuations in order to earn a higher commission. As an investor, it's important to be careful when buying unlisted shares and make sure that you're getting a fair price. At UnlistedZone, we provide our investors with a fair idea of the pricing of unlisted shares on our website. If the information is not available, investors can reach out to us directly for more information. <br /><br /><strong>5. Lack of Regulatory Oversight</strong> <br /><br />SEBI currently does not directly regulate the unlisted market, which can lead to higher levels of fraud. However, there are certain regulations in place, such as third-party share transfers being prohibited and the requirement for stamp duty and DP charges for every transaction. At UnlistedZone, we always ensure that we comply with all relevant regulations to protect our investors. In conclusion, while investing in unlisted shares can be a good way to diversify your portfolio, it's important to be aware of the risks involved. At UnlistedZone, we take steps to mitigate these risks by only investing in stocks with excellent fundamentals and good liquidity, providing regular updates to our investors, working with trusted dealers, and providing fair pricing information. If you're interested in investing in unlisted shares, we encourage you to <a href="https://unlistedzone.com/contact-us/">reach out to us</a> and learn more about how we can help you make informed investment decisions.</p>

In FY22, the company reported a revenue of 727 Cr, which increased to 927 Cr in FY23. Despite the increase in revenue, Bira's EBITDA margins remain negative, with a loss of 217 Cr in FY22 and a slightly reduced loss of 200 Cr in FY23. The company's gross margins, however, improved from 223 Cr in FY22 to 337 Cr in FY23. <strong>Impact of Commodity Price Inflation on Margins</strong> The commodity price inflation in material costs has been a significant factor impacting Bira's margins. However, the company was able to partially mitigate these effects through price increases. Additionally, active cost management and leveraging fixed costs have helped to improve EBITDA margins. Despite these efforts, the company still has a negative EBITDA, and there is a need for further cost optimisation and revenue growth to achieve profitability. <strong>Employee Benefit Expenses</strong> The employee benefit expenses have increased from 82 Cr in FY22 to 92 Cr in FY23 this is mainly due to expansion drive company is doing. <img class="alignnone size-full wp-image-25776" src="https://unlistedzone.com/storage/knowledge-logo/Bira-News-Flavours.jpeg.webp" alt="Bira Financial Results FY22-23 " width="1600" height="910" /> <strong>New Flavor: Grizly</strong> Despite the challenges faced by the company, Bira has continued to innovate and introduce new products. One of its latest offerings is the Grizly hard seltzer, a unique blend of local berries, seasonal fruits, spices, and herbs created by the company's expert mixologists. The Grizly hard seltzer promises to be a buzzy and bubbly experience that is sure to delight beer enthusiasts. <strong>Financial Performance of Bira Unlisted Share in Fy23</strong> <div class="table-overflow-init"> <table width="100%"> <thead> <tr> <th style="text-align: center;">Bira Results Update</th> <th style="text-align: center;">FY22</th> <th style="text-align: center;">FY23</th> </tr> </thead> <tbody> <tr> <td>Revenue</td> <td>727 Cr</td> <td>927 Cr</td> </tr> <tr> <td>Gross Margins</td> <td>223 Cr</td> <td>337 Cr</td> </tr> <tr> <td>Employee Benefit Expenses</td> <td>82 Cr</td> <td>92 Cr</td> </tr> <tr> <td>EBITDA</td> <td>-217 Cr</td> <td>-200 Cr</td> </tr> </tbody> </table> <strong>Conclusion</strong> In conclusion, Bira's latest financial results indicate that the company has made progress in increasing revenue and improving gross margins. However, there is still work to be done to achieve profitability, especially in light of rising costs, including employee benefit expenses. The introduction of new products like the Grizly hard seltzer is a positive sign of the company's commitment to innovation and growth. Bira needs to continue to focus on cost optimization and revenue growth to achieve sustainable profitability. https://unlistedzone.com/shares/bira-share-price-buy-sell-unlisted-shares/ </div>

<p>Hero Fincorp Limited, one of India's leading Non-Banking Financial Companies (NBFCs), has announced its financial results for the financial year 2022-23. The results indicate a solid recovery from the loss of INR 192 crore in the previous year, with the company reporting a net profit of INR 480 crore. Let's take a closer look at the company's FY23 results. <br /><br /><strong>Net Interest Income (NII) and Total Revenue</strong> <br /><br />Hero Fincorp reported a strong growth in its Net Interest Income (NII) for FY23, with the figure increasing by 38% YoY to INR 3,546 crore. This growth can be attributed to the company's focus on diversifying its loan portfolio, with a particular emphasis on secured lending. The company's Total Revenue also grew by a healthy 34% YoY to INR 6,448 crore. This was driven by the growth in the NII as well as an increase in the company's fee-based income. <br /><br /><strong>Provisioning and Asset Quality</strong> <br /><br />The company's provisioning decreased to INR 1,212 crore from the previous year, which is a positive sign for the company's asset quality. The company's Gross Non-Performing Assets (GNPAs) as a percentage of its total advances decreased to 5.11%, from 7.94% in the previous year. Similarly, the Net Non-Performing Assets (NNPAs) as a percentage of its total advances decreased to 2.69%, from 4.63% in the previous year. This indicates an improvement in the quality of the company's loan portfolio. <br /><br /><strong>Capital Adequacy and Return on Assets (RoA)</strong> <br /><br />Hero Fincorp's Capital Adequacy Ratio (CAR) increased to 23.2%, from 21.8% in the previous year. This indicates that the company has adequate capital to support its growth plans. Additionally, the company's Return on Assets (RoA) increased to 1.10%, from -0.5% in the previous year. This is a positive sign for the company's profitability. <br /><br /><strong>Valuation</strong> <br /><br />EPS of Hero Fin Corp in FY23 is 35 and Book value as on 31.03.2023 is 415 per share. So, at 1100 share price in unlisted market the P/E is 31x and P/B is 2.65x. <br /><br /><strong>Conclusion</strong> <br /><br />Overall, Hero Fincorp's FY23 results indicate a solid recovery from the loss of INR 192 crore in the previous year. The company's focus on diversifying its loan portfolio, with a particular emphasis on secured lending, has led to a healthy growth in its Net Interest Income (NII) and Total Revenue. Additionally, the decrease in provisioning and improvement in asset quality are positive signs for the company's future growth. <br /><br /><a href="https://unlistedzone.com/shares/hero-fincorp-limited-share-price-buy-sell-unlisted-shares-of-hero-fincorp/">https://unlistedzone.com/shares/hero-fincorp-limited-share-price-buy-sell-unlisted-shares-of-hero-fincorp/</a></p> <p> </p>

Motilal Oswal Home Finance Limited (MOHFL) has released its financial statements for the fiscal year 2022-23, highlighting an impressive growth trajectory. The company's total revenue for the year stood at ₹707 crore, a growth of 19.46% from the previous year's revenue of ₹592 crore. The company's net profit for the year was ₹136 crore, up by 43.15% from the previous year's net profit of ₹95 crore. <strong>Net Interest Income (NII) Improves Significantly</strong> One of the most significant improvements for MOHFL in the fiscal year 2022-23 was its Net Interest Income (NII), which increased to ₹312.86 crore from ₹271 crore in FY22. This impressive growth can be attributed to the company's focus on expanding its loan book and optimizing its interest rates. <strong>Total Expenses Decrease</strong> MOHFL also saw a reduction in its total expenses, which decreased from ₹408 crore to ₹356 crore. This reduction in expenses was due to the company's efforts to optimize its operations and reduce costs. As a result, MOHFL was able to improve its operating efficiency and increase its profitability. <strong>Provisioning in 2022-23</strong> MOHFL's provisioning for the fiscal year 2022-23 was ₹18.93 crore, which indicates that the company has been able to manage its non-performing assets (NPAs) effectively. This provision is significantly lower than the previous year's provision of ₹72 crore. <strong>Loan Book Increases</strong> One of the most important factors driving MOHFL's growth in the fiscal year 2022-23 was the increase in its loan book, which grew by 9% to ₹3,808 crore. This growth was achieved through the company's focus on expanding its customer base and increasing its product offerings. <strong>GNPA and Net NPA</strong> As on 31st March 2023, MOHFL's Gross Non-Performing Assets (GNPA) stood at 1.07% and Net Non-Performing Assets (Net NPA) at 0.55%. These numbers are an improvement from the previous year's GNPA of 2.48% and Net NPA of 1.54%. <strong>Book Value and Price-to-Book Ratio</strong> MOHFL's book value stands at 1.9, giving the company a price-to-book (P/B) ratio of 5.13x. This suggests that the company may be overvalued, and investors should exercise caution before investing in the company's shares. <strong>Conclusion</strong> MOHFL has reported an impressive growth trajectory in the fiscal year 2022-23, driven by a significant improvement in its Net Interest Income and a reduction in its total expenses. The company's focus on expanding its loan book and optimizing its operations has resulted in increased profitability and improved asset quality. However, investors should exercise caution due to the company's high price-to-book ratio https://unlistedzone.com/shares/buy-sell-share-price-aspire-home-finance-corporation-unlisted-shares/
<p>In an internal employee town hall on Thursday, OYO shared some exciting news with its staff: the company has turned cash flow positive in the fourth quarter of the financial year 2023. Here's what you need to know about OYO's latest developments and its plan to repay its debt using IPO proceeds. <br /><br /><strong>Positive Cash Flow in Q4 of FY23</strong> <br /><br />According to an internal presentation, OYO ended the fourth quarter with a surplus cash flow of Rs 90 crore. Sources close to the company say that this positive trend is expected to continue into the first quarter of financial year 2024. <br /><br /><strong>Increase in bookings across key geographies</strong> <br /><br />OYO attributes its positive cash flow to an increase in bookings across all key geographies. The Europe home business, in particular, is seeing a surge in advance bookings for both the upcoming peak summer season as well as the relatively off-season period from November to March. <br /><br /><strong>Refiled Draft Red Herring Prospectus (DRHP)<br /><br /></strong> In March, OYO refiled its Draft Red Herring Prospectus (DRHP) with the stock market regulator SEBI under the pre-filing route. People close to the company have said that the issue size has likely been reduced to $400-600 million, consisting entirely of freshly issued shares with all the proceeds going to the company. <br /><br /><strong>Repaying Debt with IPO Proceeds</strong> <br /><br />OYO plans to use the proceeds from its IPO to repay most of its debt. The company's cash corpus on the balance sheet is currently Rs 2700 crore. <br /><br /><strong>Founder's Optimistic Projections</strong> <br /><br />During a town hall meeting last month, OYO founder Ritesh Agarwal projected that the company could post adjusted earnings of nearly Rs 800 crore before interest, tax, depreciation, and amortization in the upcoming financial year 2024. He also shared that the company was taking measures to keep a "healthy" cash runaway and was continuing to operate in a "cost-effective" way. <br /><br /><strong>Expected Revenue for FY23</strong> <br /><br />OYO's revenue for financial year 2023 is expected to be more than Rs 5,700 crore, up 19% from the Rs 4,780 crore it posted in financial year 2022. <br /><br /><strong>Investing in OYO Unlisted Shares</strong> <br /><br />With OYO's positive cash flow and plans to use the IPO to repay debt, investors may be considering buying OYO's unlisted shares. However, it's important to do your own research and consult with a financial advisor before making any investment decisions, as unlisted shares are very risky.</p>

Reliance Retail has announced its financial results for FY23. In FY23, as per the results, the Company clocked the total revenue of 2,60,364 crore as against Rs. 1,99,704 crore with 30% YoY growth. The net revenue of the Company increased 32% to Rs. 2,30,931 crore as against Rs. 1,74,980 crore in the previous financial year. EBITDA from operations registered record growth of 61% to Rs. 17,609 crore as against Rs. 10,932 crore in the previous financial year. In FY23, the Profit After Tax of the Company increased 30% to Rs. 9,181 crore as against Rs. 7055 crore in the previous financial year. <strong>Performance Highlights –</strong> <strong>Consumer Electronics</strong> <strong>1.</strong> The Consumer Electronics sector, excluding Devices, achieved an exceptional YoY growth of 37%, while the Devices category experienced a slower rate of growth. <strong>2.</strong> During the Republic Day sales period, the company witnessed its best-ever sales period with a 35% YoY growth rate, primarily fueled by attractive financing schemes and offers. <strong>3.</strong> Across various categories, the company observed steady growth, and they strategically leveraged the Pre-IPL sales period to drive sales of TVs through targeted promotions. <strong>4.</strong> The resQ division, which focuses on providing services, reported robust growth, primarily driven by the expansion of service plans and categories, and they also increased the number of service centers by over 200. <strong>5.</strong> The company's own brands and PBG sales grew twice as fast as the industry average, and the merchant base expanded by a remarkable 80% YoY. <strong>6.</strong> The JMD achieved remarkable YoY growth of 5.5X, primarily driven by sales of phones and large appliances, and the merchant base expanded threefold YoY. <strong>Fashion and Lifestyle</strong> The company has reported a strong performance in its offline business, which continues to gain momentum. This growth is attributed to the higher average bill value and better conversion rates. The company has seen broad-based growth across categories, with men's formals, women's ethnic wear, and kids wear leading the way. The company has executed marketing events well, targeting the wedding season and festivals, and sponsored Femina Miss India. They have also launched new formats like GAP and Portico standalone stores to serve diverse customer segments. Ajio reported another strong quarter, with improvements across all operational metrics. The focus is on improving the customer experience by growing the product catalogue, which now has over 13 lakh live options. Partner Brands are leading the premium and luxury segment, with the widest portfolio, and revenue has increased by 35 percent year on year. The company has also strengthened its food and beverage portfolio with exclusive partnerships with EL&N café. They have entered into a joint venture with Circle E Retail to vertically integrate their toy business. In the Jewels segment, the company has capitalized on festivals and wedding seasons through impactful events and promotions to drive sales. Tier 2 and beyond towns are driving growth momentum, and there is a continued focus on strengthening the product offering. The company has launched new collections like Diamond Delight Lite and Valentine's Day collection. Urban Ladder is expanding their store network to provide customers with an omnichannel experience. The company's Republic Day and Color Crush Sales drove higher traffic, and they have enhanced the customer experience by offering a wider product range with a catalogue that has doubled year on year. <strong>Jio Mart</strong> Jio Mart, the online grocery platform, reported its best-ever quarter, with significant growth across all operational metrics. The platform is also expanding its catalogue and seller base, with a 34% increase in options and a 56% increase in sellers. Additionally, Jio Mart is diversifying into non-grocery categories by bringing brands like Trends, Hamleys, and Urban Ladder onto its platform. <strong>Pharma</strong> In the pharmaceutical sector, revenue rose by 51%, driven by offline network expansion and the launch of standalone stores offering pharma and wellness products. The company is leveraging its omnichannel capabilities to serve customers, and successful marketing events are driving customer engagement and traffic. Moreover, the new commerce segment is growing rapidly, with operations now expanded to more than 2,600 cities.

<p>HDFC Securities Limited (HSL), a leading retail broking firm and a subsidiary of HDFC Bank, has recently disclosed its financial results for the fiscal year ending March 31, 2023. Despite the various market challenges, HDFC Securities has managed to navigate the turbulent financial waters with considerable resilience.</p> <p>For the quarter ending March 31, 2023, HDFC Securities reported a total revenue of Rs. 486.1 crore. This figure represents a slight decline from the Rs. 509.7 crore revenue achieved in the same quarter of the previous year. Additionally, the profit after tax for this quarter stood at Rs. 193.8 crore, a decrease compared to Rs. 235.6 crore in the corresponding quarter of the previous year.</p> <p>The annual performance of HDFC Securities also reflected a similar trend. The company's total income for the year ended March 31, 2023, was recorded at Rs. 1,891.6 crore, showing a decrease from Rs. 1,990.3 crore in the prior year. Furthermore, the net profit for the year was reported at Rs. 777.2 crore, down from Rs. 984.3 crore for the fiscal year ending March 31, 2022.</p> <p>Despite these financial headwinds, HDFC Securities has maintained a strong physical presence across India. As of March 31, 2023, the company boasts a network of 209 branches located in 147 cities and towns, ensuring a wide-reaching service delivery. HDFC Securities continues to offer a diverse array of financial products and services, ranging from equity trading to mutual funds and insurance, catering to the varied needs of its clientele.</p> <p>This financial year's performance of HDFC Securities highlights the firm's enduring commitment to serving its customers, despite the challenging economic landscape. While the slight downturn in revenue and profit indicates the impact of market volatility, the firm's extensive branch network and diverse service offerings position it well for future growth and stability in the dynamic world of financial services</p> <p><br /><a href="https://unlistedzone.com/shares/hdfc-securities-limited-share-price-buy-sell-hdfc-securities-unlisted-shares/">https://unlistedzone.com/shares/hdfc-securities-limited-share-price-buy-sell-hdfc-securities-unlisted-shares/ </a><br /><br /><em>Note: Check the Latest <span style="font-weight: 400;">HDFC Securities Limited</span> <a href="https://unlistedzone.com/shares/">Unlisted Shares Price</a> at UnlisteZone <a href="https://play.google.com/store/apps/details?id=com.unlistedzone.android&pli=1">Android</a> or <a href="https://apps.apple.com/in/app/unlistedzone/id1640469608">iOS</a> Mobile App.</em></p>
<p><span style="font-weight: 400;">HDB Financial Services Limited (HDBFSL) is a non-banking finance company (NBFC) that offers a wide range of loans and asset finance products to individuals, emerging businesses, and micro-enterprises. As on March 31, 2023, </span> <span style="font-weight: 400;">HDFC Bank has a significant 94.8% stake in HDBFSL.</span> <br /><br /><span style="font-weight: 400;">The company's net revenue for the quarter ended March 31, 2023, was recorded at Rs. 2282.5 crore, a growth of 5.7% from the same quarter in the previous year. Similarly, the profit after tax for the same quarter in the current year was Rs. 545.5 crore, an increase of 27.7% over the previous year's same quarter.</span> <br /><br /><span style="font-weight: 400;">For the year ended March 31, 2023, the company's net revenue grew by 11.4% to Rs. 8,891.0 crore, compared to Rs. 7,980.8 crore in the previous year. The company's profit after tax for the year ended March 31, 2023, was recorded at Rs. 1,959.4 crore, a significant increase of 93.7% from the previous year's profit of Rs. 1,011.4 crore.</span> <br /><br /><span style="font-weight: 400;">The company's total loan book was Rs. 70,031 crore as of March 31, 2023. The stage 3 loans were at 2.73% of gross loans, indicating the company's ability to maintain high asset quality. Additionally, as of March 31, 2023, the total CAR was recorded at 20.1%, with Tier-1 CAR at 15.9%, which highlights the company's robust financial position.</span> <br /><br /><span style="font-weight: 400;">HDBFSL has a strong and wide presence with 1,492 branches spread across 1,054 cities/towns as of March 31, 2023. This wide network has enabled the company to serve its diverse customer base with its specialized loan and asset finance products.</span> <br /><br /><a href="https://unlistedzone.com/shares/buy-sell-hdb-financial-services-unlisted-shares-hdb-finance-share-price/">https://unlistedzone.com/shares/buy-sell-hdb-financial-services-unlisted-shares-hdb-finance-share-price/</a></p> <p><em>Note: Check the Latest HDB Financial Services <a href="https://unlistedzone.com/shares/">Unlisted Shares Price</a> at UnlisteZone <a href="https://play.google.com/store/apps/details?id=com.unlistedzone.android&pli=1">Android</a> or <a href="https://apps.apple.com/in/app/unlistedzone/id1640469608">iOS</a> Mobile App.</em></p>
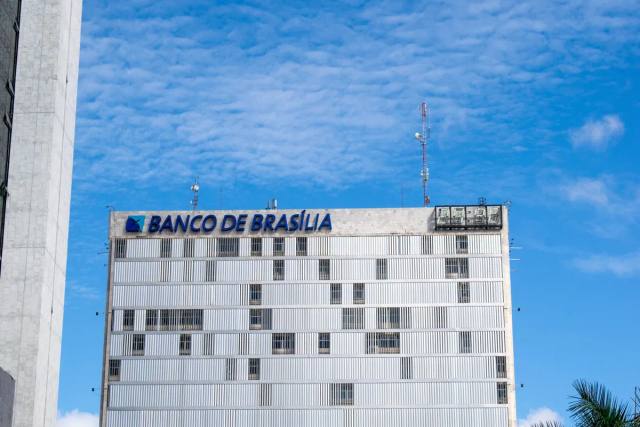
<h4><b>1. What is the purpose of Capital Small Finance Bank raising funds?</b></h4> <span style="font-weight: 400;"><a href="https://www.capitalbank.co.in/">Capital Small Finance Bank</a> is raising funds of Rs. 65 crores from 6 different investors on a private placement basis, under the preferential issue of upto 13,82,700 equity shares of the Bank having Face Value of ₹10/- (Rupees Ten) each at a premium of ₹458/-</span> <span style="font-weight: 400;">In 2014, approval was granted for the conversion of ‘Capital Local Area Bank Limited’ into ‘Small Finance Bank’ by RBI and the Bank started its operations as a small finance bank in 2016. </span> <span style="font-weight: 400;">As the bank received the license as a small finance bank, the geographical barriers were removed and the bank has planned to expand its operations to new regions exponentially. To meet the expenses for expansion as well as working capital requirements of the bank, the Bank needs capital to execute its growth plans and to meet the Regulatory requirement of maintaining capital adequacy of 15% and leverage the debt capital. </span> <h4><b>2. Who are the investors from which company is raising funds?</b></h4> <span style="font-weight: 400;">Following the details of investors and their investments in the Bank. </span> <div class="table-overflow-init"> <table width="100%"> <tbody> <tr> <td style="text-align: center;" data-sheets-value="{"1":2,"2":"Sr. NO."}">Sr. NO.</td> <td style="text-align: center;" data-sheets-value="{"1":2,"2":"Name of Investor "}">Name of Investor</td> <td style="text-align: center;" data-sheets-value="{"1":2,"2":"No of Shares to be allotted "}">Shares to be allotted</td> <td style="text-align: center;" data-sheets-value="{"1":2,"2":"Face Value per Equity Share (In ₹)"}">Face Value</td> <td style="text-align: center;" data-sheets-value="{"1":2,"2":"Premium per Equity Share (In ₹)"}">Premium</td> <td style="text-align: center;" data-sheets-value="{"1":2,"2":"Consideration (Amount in ₹)"}">Consideration</td> </tr> <tr> <td style="text-align: center;" data-sheets-value="{"1":3,"3":1}">1</td> <td style="text-align: center;" data-sheets-value="{"1":2,"2":"Max Life Insurance Company Limited"}">Max Life Insurance</td> <td style="text-align: center;" data-sheets-value="{"1":2,"2":"upto 10,57,700"}">upto 10,57,700</td> <td style="text-align: center;" data-sheets-value="{"1":2,"2":"10/-"}">10/-</td> <td style="text-align: center;" data-sheets-value="{"1":2,"2":"458/-"}">458/-</td> <td style="text-align: center;" data-sheets-value="{"1":2,"2":"upto ₹49.51Crores"}">₹49.51 Cr</td> </tr> <tr> <td style="text-align: center;" data-sheets-value="{"1":3,"3":2}">2</td> <td style="text-align: center;" data-sheets-value="{"1":2,"2":"Small Industries Development Bank of India"}">SIDBI</td> <td style="text-align: center;" data-sheets-value="{"1":2,"2":"upto 54,350"}">upto 54,350</td> <td style="text-align: center;" data-sheets-value="{"1":2,"2":"10/-"}">10/-</td> <td style="text-align: center;" data-sheets-value="{"1":2,"2":"458/-"}">458/-</td> <td style="text-align: center;" data-sheets-value="{"1":2,"2":"upto ₹2.45Crores"}">₹2.45 Cr</td> </tr> <tr> <td style="text-align: center;" data-sheets-value="{"1":3,"3":3}">3</td> <td style="text-align: center;" data-sheets-value="{"1":2,"2":"Amicus Capital Private Equity I LLP"}">Amicus Capital PE</td> <td style="text-align: center;" data-sheets-value="{"1":2,"2":"upto 60,870"}">upto 60,870</td> <td style="text-align: center;" data-sheets-value="{"1":2,"2":"10/-"}">10/-</td> <td style="text-align: center;" data-sheets-value="{"1":2,"2":"458/-"}">458/-</td> <td style="text-align: center;" data-sheets-value="{"1":2,"2":"upto ₹2.85Crores"}">₹2.85 Cr</td> </tr> <tr> <td style="text-align: center;" data-sheets-value="{"1":3,"3":4}">4</td> <td style="text-align: center;" data-sheets-value="{"1":2,"2":"Amicus Capital Partners India Fund I"}">Amicus Capital Partners</td> <td style="text-align: center;" data-sheets-value="{"1":2,"2":"upto 7065"}">upto 7065</td> <td style="text-align: center;" data-sheets-value="{"1":2,"2":"10/-"}">10/-</td> <td style="text-align: center;" data-sheets-value="{"1":2,"2":"458/-"}">458/-</td> <td style="text-align: center;" data-sheets-value="{"1":2,"2":"upto ₹.33Crores"}">₹.33 Cr</td> </tr> <tr> <td style="text-align: center;" data-sheets-value="{"1":3,"3":5}">5</td> <td style="text-align: center;" data-sheets-value="{"1":2,"2":"PiVenturesLLP"}">PiVenturesLLP</td> <td style="text-align: center;" data-sheets-value="{"1":2,"2":"upto 67,935"}">upto 67,935</td> <td style="text-align: center;" data-sheets-value="{"1":2,"2":"10/-"}">10/-</td> <td style="text-align: center;" data-sheets-value="{"1":2,"2":"458/-"}">458/-</td> <td style="text-align: center;" data-sheets-value="{"1":2,"2":"upto ₹3.18Crores"}">₹3.18 Cr</td> </tr> <tr> <td style="text-align: center;" data-sheets-value="{"1":3,"3":6}">6</td> <td style="text-align: center;" data-sheets-value="{"1":2,"2":"Oman India Joint Investment Fund II"}">Oman India</td> <td style="text-align: center;" data-sheets-value="{"1":2,"2":"upto1,34,780"}">upto1,34,780</td> <td style="text-align: center;" data-sheets-value="{"1":2,"2":"10/-"}">10/-</td> <td style="text-align: center;" data-sheets-value="{"1":2,"2":"458/-"}">458/-</td> <td style="text-align: center;" data-sheets-value="{"1":2,"2":"upto ₹6.31Crores"}">₹6.31 Cr</td> </tr> </tbody> </table> <h4><b>3. What is the valuation at which the company is raising funds? </b></h4> <span style="font-weight: 400;">The valuation at which the Company is raising funds can be calculated as per the given formula- </span> <span style="font-weight: 400;">Valuation = (Total number of outstanding shares)*(current share price)</span> <span style="font-weight: 400;">Total number of outstanding shares </span><span style="font-weight: 400;">= 3,56,35,154 ( As on 15.04.2023) </span> <span style="font-weight: 400;">Issue Price = Rs. 458 </span> <span style="font-weight: 400;">Valuation = 3,56,35,154*458 ≈ Rs. 1632 crore crores</span> <span style="font-weight: 400;">So, the Company is raising the fund at the valuation of Rs. 1632 crore. </span> <h4><b> 4. What is the P/B value of the company at which this funding is raised?</b></h4> <span style="font-weight: 400;">As of March 31.12.2022, the book value of the Company is 172, and the per share price is Rs. 425. The P/B value can be calculated using the given formula- </span> <span style="font-weight: 400;">P/B = Currency share price/ Book Value </span> <span style="font-weight: 400;">P/B = 425/172 = 2.47</span> <span style="font-weight: 400;">So, the Company is raising funds at a P/B of 2.47. </span> <h4><b>5. What is the value at which ESOP are issued by a company?</b></h4> <span style="font-weight: 400;">The board has decided to issue ESOP up to 6,85,049 fully paid-up equity shares in the Bank of the face value of ₹10/- each at a premium of ₹161/- each aggregating to ₹171/- each.</span> <em>Note: Check the Latest Capital Small Finance Bank <a href="https://unlistedzone.com/shares/">Unlisted Shares Price</a> at UnlisteZone <a href="https://play.google.com/store/apps/details?id=com.unlistedzone.android&pli=1">Android</a> or <a href="https://apps.apple.com/in/app/unlistedzone/id1640469608">iOS</a> Mobile App.</em> </div>

<p><span style="font-weight: 400;">Cashinvoice, a digital supply chain finance </span><span style="font-weight: 400;">platform, has collaborated with Hero Fincorp to provide financing solutions to a pool of micro, small, and medium-sized enterprises (MSMEs). The aim of the collaboration is to cater the supply chain finance offerings and address the issue of liquidity for MSMEs. Hero Fincorp's strong Capital base and Chashinvoice technological expertise combined together will help them to penetrate into supply chain finance programs. It will also provide liquidity to vendors and credit to small businesses. </span> <span style="font-weight: 400;">Chashinvoice is engaged in providing customized supply chain financing solutions with the help of its digital marketplace for invoice discount to suppliers and buyers of medium and larger organizations. <br /><br />Chashinvoice has experienced growth of 103 %in Q3FY23 compared to the same period previous year. The Company is aiming to bridge the credit gap of 20-25 lakh crores. </span> <span style="font-weight: 400;">Economics Times reported, Arun Poojari, CEO and Co-founder Cashinvoice said in a statement, "We are constantly looking for ways to enhance the flow of credit within the business ecosystem to ensure an undisturbed supply chain among various stakeholders. Access to timely MSME funding, complex regulatory procedures, and insufficient financial knowledge are some of the daunting obstacles faced by MSMEs in India. <br /><br />Understanding these challenges and streamlining MSME business financing in India is important to achieve India's goal of becoming a global economic power. We are thrilled to have Hero FinCorp, India's leading NBFC, on board to act as financial aid on our journey to create solutions to solve the working capital gap in India. <br /><br />Through this association, we aim at facilitating INR 10,000 Crores of MSMES purchases in FY24."</span> <span style="font-weight: 400;">The collaboration with Hero Fincorp will provide financial inclusion in the economy and is expected to break the conventional norms extending the lending business to tier 2 and tier 3 cities. During the first year of partnership, the aim is to disburse Rs.1000 crore.</span> https://unlistedzone.com/shares/hero-fincorp-limited-share-price-buy-sell-unlisted-shares-of-hero-fincorp/</p>
Indicative prices, company research and your enquiries — in your pocket. Get price notes on the names you follow and reach our team from anywhere.