Analysis, guides and explainers on India's unlisted market — from IPO pipelines to ESOP liquidity.

<h2 data-pm-slice="1 1 []">A) What’s the Latest Funding Update on Eeki?</h2> <p>Kota-based agritech startup <strong>Eeki</strong> has raised <strong>$7 million</strong> in fresh funding from <strong>Sixth Sense Ventures</strong>, marking a significant milestone after a three-year funding gap. This round brings the <strong>total funds raised by Eeki to approximately $15 million</strong>, including:</p> <ul data-spread="false"> <li> <p><strong>$6.5 million in Series A funding (2022)</strong>, led by General Catalyst</p> </li> <li> <p><strong>$2 million in early 2022</strong>, led by Avaana Capital</p> </li> </ul> <p>This latest infusion of capital is set to <strong>accelerate Eeki’s next phase of growth</strong> in sustainable and scalable farming.</p> <div><hr /></div> <h2>B) How Will Eeki Utilize This Capital?</h2> <p>Eeki plans to deploy the newly raised funds to:</p> <ul data-spread="false"> <li> <p><strong>Expand its climate-resilient farming operations across India</strong></p> </li> <li> <p><strong>Strengthen R&D</strong> to optimize yield and diversify crop varieties</p> </li> <li> <p><strong>Scale the deployment of its Gen 3 aeroponic growing chambers</strong></p> </li> <li> <p><strong>Grow its farming footprint</strong> to reach more non-arable and rural regions</p> </li> </ul> <p>With <strong>30% of its team dedicated to core tech and innovation</strong>, the startup aims to optimize resource usage while enhancing production outcomes.</p> <div><hr /></div> <h2>C) What Makes Eeki’s Farming Model Unique?</h2> <p>At the heart of Eeki’s model is its <strong>patented climate-controlled aeroponic system</strong>, a soil-free farming method where plant roots are suspended in air and nourished with nutrient-rich mist.</p> <h3>Key Features of Eeki’s Innovation:</h3> <ul data-spread="false"> <li> <p><strong>95% less water usage</strong> compared to traditional farming</p> </li> <li> <p><strong>Year-round cultivation</strong>, independent of seasons or soil quality</p> </li> <li> <p><strong>Higher yields and consistent quality</strong> of produce</p> </li> <li> <p><strong>Pesticide-free, nutrient-rich vegetables</strong></p> </li> <li> <p>Viable on <strong>barren or non-arable lands</strong></p> </li> </ul> <p>This approach allows Eeki to offer <strong>farm-fresh vegetables at costs similar to conventional farming</strong>, while tackling challenges like <strong>soil degradation and water scarcity</strong>.</p> <div><hr /></div> <h2>D) What is the Market Size and Growth Potential of Aeroponic Farming?</h2> <h3><strong>Market Opportunity</strong></h3> <ul data-spread="false"> <li> <p>The <strong>Indian agritech market</strong> is projected to reach <strong>$24.1 billion by 2025</strong>, but currently captures only <strong>1% of its potential</strong>.</p> </li> <li> <p>The <strong>global aeroponics market</strong> is expected to grow from <strong>$578 million in 2024 to over $2.1 billion by 2030</strong>, registering a CAGR of <strong>20%+</strong>.</p> </li> </ul> <h3> Key Drivers:</h3> <ul data-spread="false"> <li> <p>Climate change & resource scarcity</p> </li> <li> <p>Urban population growth & demand for fresh produce</p> </li> <li> <p>Government incentives for precision farming and sustainable agri-tech</p> </li> <li> <p>Rising awareness about pesticide-free, local produce</p> </li> </ul> <div><hr /></div> <h2>E) Who Are Eeki’s Competitors in This Space?</h2> <p>While Eeki is a frontrunner in climate-resilient aeroponics, other key players in India’s agritech and precision farming space include:</p> <table style="width: 81.6459%; height: 114.231px;"> <tbody> <tr style="height: 21.9231px;"> <th style="width: 25.316%; height: 21.9231px; text-align: center;"><strong>Startup</strong></th> <th style="width: 48.7828%; height: 21.9231px; text-align: center;"><strong>Core Focus</strong></th> <th style="width: 25.9269%; height: 21.9231px; text-align: center;"><strong>Funding Raised</strong></th> </tr> <tr style="height: 18.4615px;"> <td style="width: 25.316%; height: 18.4615px; text-align: center;"><strong>AgNext</strong></td> <td style="width: 48.7828%; height: 18.4615px; text-align: center;">Quality assessment & analytics</td> <td style="width: 25.9269%; height: 18.4615px; text-align: center;">~$30M</td> </tr> <tr style="height: 18.4615px;"> <td style="width: 25.316%; height: 18.4615px; text-align: center;"><strong>Ninjacart</strong></td> <td style="width: 48.7828%; height: 18.4615px; text-align: center;">Supply chain for fresh produce</td> <td style="width: 25.9269%; height: 18.4615px; text-align: center;">$200M+</td> </tr> <tr style="height: 18.4615px;"> <td style="width: 25.316%; height: 18.4615px; text-align: center;"><strong>UrbanKisaan</strong></td> <td style="width: 48.7828%; height: 18.4615px; text-align: center;">Hydroponic and vertical farming</td> <td style="width: 25.9269%; height: 18.4615px; text-align: center;">Undisclosed</td> </tr> <tr style="height: 18.4615px;"> <td style="width: 25.316%; height: 18.4615px; text-align: center;"><strong>Clover</strong></td> <td style="width: 48.7828%; height: 18.4615px; text-align: center;">Controlled-environment agriculture</td> <td style="width: 25.9269%; height: 18.4615px; text-align: center;">~$8M</td> </tr> <tr style="height: 18.4615px;"> <td style="width: 25.316%; height: 18.4615px; text-align: center;"><strong>Hydroponics India</strong></td> <td style="width: 48.7828%; height: 18.4615px; text-align: center;">Hydroponic systems & consulting</td> <td style="width: 25.9269%; height: 18.4615px; text-align: center;">Bootstrapped</td> </tr> </tbody> </table> <p>However, <strong>Eeki’s patented Gen 3 aeroponic chambers</strong>, coupled with <strong>hardware innovation and strong R&D</strong>, offer a <strong>distinct edge</strong> in precision and scale of climate-resilient farming.</p> <div><hr /></div> <h2>F) What is Eeki’s Long-Term Vision?</h2> <h3>Founders’ Mission:</h3> <ul data-spread="false"> <li> <p><strong>Abhay Singh (CEO)</strong> and <strong>Amit Kumar (Co-founder)</strong> aim to build a <strong>future-ready, scalable food production ecosystem</strong>.</p> </li> <li> <p>The vision: Make <strong>nutritious, pesticide-free food accessible, affordable, and sustainable for all</strong>, regardless of geography or climate conditions.</p> </li> </ul> <blockquote> <p>“This funding marks a pivotal moment toward scaling climate-resilient farming across India and beyond,” said <strong>Abhay Singh</strong>.</p> <p>“With Sixth Sense’s support, we aim to position Eeki as a leader in nutrition and origin,” added <strong>Amit Kumar</strong>.</p> </blockquote> <div><hr /></div> <h2>G) What Do the Investors Say?</h2> <p><strong>Nikhil Vora</strong>, Founder & CEO of <strong>Sixth Sense Ventures</strong>, commented:</p> <blockquote> <p>“Eeki’s breakthrough model has proven itself in India’s toughest farming conditions. Backed by R&D and sharp execution, it has the potential to become the <strong>world’s most efficient farming company</strong>.”</p> </blockquote> <p>The firm was particularly impressed by Eeki’s <strong>cost efficiency, scalability, and science-led approach</strong> to sustainable agriculture.</p> <div><hr /></div> <h2>H) What Does This Mean for the Future of Farming in India?</h2> <p>Eeki is leading the charge toward <strong>climate-smart agriculture</strong>, offering a scalable solution for food production that:</p> <ul data-spread="false"> <li> <p>Tackles <strong>environmental degradation</strong></p> </li> <li> <p>Reduces <strong>water dependency</strong></p> </li> <li> <p>Boosts <strong>local availability of nutritious produce</strong></p> </li> <li> <p>Creates <strong>jobs and infrastructure in non-arable regions</strong></p> </li> </ul> <p>With increasing <strong>government focus on sustainable agriculture</strong> and rising <strong>consumer demand for clean food</strong>, Eeki is well-positioned to disrupt conventional farming norms.</p> <div><hr /></div> <h2>📌 <strong>Final Takeaway</strong></h2> <p><strong>Eeki’s $7 million raise</strong> is not just a funding update—it signals the <strong>rising importance of innovation-led, sustainable farming models</strong> in India. Backed by deep R&D and strong investor confidence, Eeki’s aeroponic technology could become a <strong>blueprint for future agriculture</strong>, ensuring food security while conserving vital resources.</p> <div><hr /></div> <p><strong>Disclaimer:</strong> This article is for informational purposes only and <strong>does not constitute investment advice</strong>. Please conduct your own due diligence or consult a registered financial advisor before making any investment decisions.</p>
<h3 data-pm-slice="1 1 []">1. Business Model of Vikram Solar</h3> <p>Vikram Solar Limited is a vertically integrated solar energy company specializing in high-efficiency photovoltaic (PV) modules. As of March 2024, it boasts an installed capacity of 3.50 GW but Currently expanded to 4.5GW as of Apr 2025.</p> <p>with an ambitious roadmap to expand to 15.50 GW by FY27.</p> <h4>Key Business Verticals:</h4> <ul data-spread="false"> <li> <p><strong>Solar PV Module Manufacturing:</strong> Focus on high-efficiency mono PERC and bifacial panels.</p> </li> <li> <p><strong>OEM & Private Label Contracts:</strong> Manufactures solar modules for third-party brands.</p> </li> <li> <p><strong>Turnkey Project Execution:</strong> Executes large-scale solar projects including floating solar plants and airport installations.</p> </li> <li> <p><strong>Operations & Maintenance (O&M):</strong> Offers asset lifecycle management and extended service warranties.</p> </li> </ul> <h4>Clients & Markets:</h4> <ul data-spread="false"> <li> <p>Government agencies (SECI, NTPC, etc.)</p> </li> <li> <p>Private developers in India and abroad</p> </li> <li> <p>Export markets: USA, Europe, Africa, and Southeast Asia</p> </li> </ul> <p>The company’s strategic location near ports allows it to efficiently manage domestic and international logistics.</p> <div><hr /></div> <h3>2. How Vikram Solar Makes Money</h3> <h4>Revenue Streams:</h4> <table style="width: 76.5195%;"> <tbody> <tr> <th style="width: 23.738%; text-align: center;">Segment</th> <th style="width: 16.371%; text-align: center;">FY22 (₹ Cr)</th> <th style="width: 16.371%; text-align: center;">FY23 (₹ Cr)</th> <th style="width: 20.456%; text-align: center;">FY24 (₹ Cr)</th> <th style="width: 22.9272%; text-align: center;">% Revenue (FY24)</th> </tr> <tr> <td style="width: 23.738%; text-align: center;">PV Module Sales</td> <td style="width: 16.371%; text-align: center;">669.02</td> <td style="width: 16.371%; text-align: center;">971.15</td> <td style="width: 20.456%; text-align: center;">2,444.11</td> <td style="width: 22.9272%; text-align: center;">97.34%</td> </tr> <tr> <td style="width: 23.738%; text-align: center;">EPC & Others</td> <td style="width: 16.371%; text-align: center;">1,061.29</td> <td style="width: 16.371%; text-align: center;">1,102.08</td> <td style="width: 20.456%; text-align: center;">66.88</td> <td style="width: 22.9272%; text-align: center;">2.66%</td> </tr> <tr> <td style="width: 23.738%; text-align: center;"><strong>Total Revenue</strong></td> <td style="width: 16.371%; text-align: center;">1,730.31</td> <td style="width: 16.371%; text-align: center;">2,073.23</td> <td style="width: 20.456%; text-align: center;">2,510.99</td> <td style="width: 22.9272%; text-align: center;">100%</td> </tr> </tbody> </table> <blockquote> <p>✔️ Sharp transition to a module-centric model, with 97% of FY24 revenue from PV module sales.</p> </blockquote> <h4>Export Contribution:</h4> <table style="width: 65.6418%;"> <tbody> <tr> <td style="text-align: center; width: 21.6175%;">Region</td> <td style="text-align: center; width: 45.0038%;">FY24 Export Revenue (₹ Cr)</td> <td style="text-align: center; width: 33.4089%;">% of Export Revenue</td> </tr> <tr> <td style="text-align: center; width: 21.6175%;">USA</td> <td style="text-align: center; width: 45.0038%;">1,534.19</td> <td style="text-align: center; width: 33.4089%;">99.22%</td> </tr> <tr> <td style="text-align: center; width: 21.6175%;">Rest of World</td> <td style="text-align: center; width: 45.0038%;">12.07</td> <td style="text-align: center; width: 33.4089%;">0.78%</td> </tr> <tr> <td style="text-align: center; width: 21.6175%;"><strong>Total</strong></td> <td style="text-align: center; width: 45.0038%;">1,546.26</td> <td style="text-align: center; width: 33.4089%;">100%</td> </tr> </tbody> </table> <blockquote> <p>✔️ The U.S. remains Vikram Solar’s dominant export destination, contributing over 99% of export revenue in FY24.</p> </blockquote> <h4>Client Concentration:</h4> <ul data-spread="false"> <li> <p><strong>Top 5 clients:</strong> 76.13% of total revenue</p> </li> <li> <p><strong>Top 10 clients:</strong> 89.38% of total revenue</p> </li> </ul> <div><hr /></div> <h3>3. Company Financials (FY22–FY24)</h3> <table style="width: 62.8911%;"> <tbody> <tr> <td style="width: 41.2468%; text-align: center;"><strong>Metric</strong></td> <td style="width: 20.1846%; text-align: center;"><strong>FY22</strong></td> <td style="width: 19.307%; text-align: center;"><strong>FY23</strong></td> <td style="width: 19.307%; text-align: center;"><strong>FY24</strong></td> </tr> <tr> <td style="width: 41.2468%; text-align: center;">Revenue (₹ Cr)</td> <td style="width: 20.1846%; text-align: center;">1,730.31</td> <td style="width: 19.307%; text-align: center;">2,073.23</td> <td style="width: 19.307%; text-align: center;">2,510.99</td> </tr> <tr> <td style="width: 41.2468%; text-align: center;">EBITDA (₹ Cr)</td> <td style="width: 20.1846%; text-align: center;">58.68</td> <td style="width: 19.307%; text-align: center;">186.18</td> <td style="width: 19.307%; text-align: center;">398.58</td> </tr> <tr> <td style="width: 41.2468%; text-align: center;">EBITDA Margin (%)</td> <td style="width: 20.1846%; text-align: center;">3.39%</td> <td style="width: 19.307%; text-align: center;">8.98%</td> <td style="width: 19.307%; text-align: center;">15.87%</td> </tr> <tr> <td style="width: 41.2468%; text-align: center;">PAT (₹ Cr)</td> <td style="width: 20.1846%; text-align: center;">(62.94)</td> <td style="width: 19.307%; text-align: center;">14.49</td> <td style="width: 19.307%; text-align: center;">79.72</td> </tr> <tr> <td style="width: 41.2468%; text-align: center;">PAT Margin (%)</td> <td style="width: 20.1846%; text-align: center;">(3.64%)</td> <td style="width: 19.307%; text-align: center;">0.70%</td> <td style="width: 19.307%; text-align: center;">3.17%</td> </tr> <tr> <td style="width: 41.2468%; text-align: center;">EPS (₹)</td> <td style="width: 20.1846%; text-align: center;">(2.43)</td> <td style="width: 19.307%; text-align: center;">0.56</td> <td style="width: 19.307%; text-align: center;">3.08</td> </tr> <tr> <td style="width: 41.2468%; text-align: center;">Net Debt (₹ Cr)</td> <td style="width: 20.1846%; text-align: center;">567.15</td> <td style="width: 19.307%; text-align: center;">633.59</td> <td style="width: 19.307%; text-align: center;">692.60</td> </tr> <tr> <td style="width: 41.2468%; text-align: center;">Debt-Equity Ratio</td> <td style="width: 20.1846%; text-align: center;">2.00x</td> <td style="width: 19.307%; text-align: center;">2.02x</td> <td style="width: 19.307%; text-align: center;">1.81x</td> </tr> <tr> <td style="width: 41.2468%; text-align: center;">ROE (%)</td> <td style="width: 20.1846%; text-align: center;">(16.44%)</td> <td style="width: 19.307%; text-align: center;">4.05%</td> <td style="width: 19.307%; text-align: center;">19.67%</td> </tr> <tr> <td style="width: 41.2468%; text-align: center;">ROCE (%)</td> <td style="width: 20.1846%; text-align: center;">2.22%</td> <td style="width: 19.307%; text-align: center;">12.78%</td> <td style="width: 19.307%; text-align: center;">20.76%</td> </tr> </tbody> </table> <blockquote> <p>Profit turnaround with improving margins and returns; strong EBITDA growth by over 6.8x in two years.</p> </blockquote> <div><hr /></div> <h3>4. Industry Analysis – Porter’s Five Forces Framework</h3> <table style="width: 100.026%;"> <tbody> <tr> <td style="width: 19.6535%; text-align: center;">Force</td> <td style="width: 66.4784%; text-align: center;">Analysis</td> <td style="width: 13.8881%; text-align: center;">Impact</td> </tr> <tr> <td style="text-align: center; width: 19.6535%;"><strong>1. Threat of New Entrants</strong></td> <td style="text-align: center; width: 66.4784%;">High capital investment & regulatory compliance, though PLI schemes offer support.</td> <td style="text-align: center; width: 13.8881%;">Moderate</td> </tr> <tr> <td style="text-align: center; width: 19.6535%;"><strong>2. Supplier Power</strong></td> <td style="text-align: center; width: 66.4784%;">Raw materials like polysilicon are concentrated in a few global suppliers.</td> <td style="text-align: center; width: 13.8881%;">High</td> </tr> <tr> <td style="text-align: center; width: 19.6535%;"><strong>3. Buyer Power</strong></td> <td style="text-align: center; width: 66.4784%;">Large institutional buyers & government tenders create price pressure.</td> <td style="text-align: center; width: 13.8881%;">Very High</td> </tr> <tr> <td style="text-align: center; width: 19.6535%;"><strong>4. Threat of Substitutes</strong></td> <td style="text-align: center; width: 66.4784%;">Solar remains the most cost-effective renewable energy solution.</td> <td style="text-align: center; width: 13.8881%;">Low</td> </tr> <tr> <td style="text-align: center; width: 19.6535%;"><strong>5. Industry Rivalry</strong></td> <td style="text-align: center; width: 66.4784%;">Highly competitive with players like Adani Solar, Waaree, Premier Energies.</td> <td style="text-align: center; width: 13.8881%;">Very High</td> </tr> </tbody> </table> <h4> </h4> <h4>Government & Sectoral Tailwinds:</h4> <ul data-spread="false"> <li> <p>India's 2030 renewable energy target: <strong>500 GW</strong></p> </li> <li> <p>MNRE’s ALMM policy gives preference to domestic manufacturers</p> </li> <li> <p>PLI scheme boosts capex capacity of players like Vikram Solar</p> </li> </ul> <div><hr /></div> <h3>5. Unlisted Market Performance (2023–2025)</h3> <table style="width: 50.888%;"> <tbody> <tr> <td style="text-align: center; width: 21.5566%;">Period</td> <td style="text-align: center; width: 31.7821%;">Price Range (₹)</td> <td style="text-align: center; width: 46.7059%;">Return vs. Base (₹150)</td> </tr> <tr> <td style="text-align: center; width: 21.5566%;">Early 2024</td> <td style="text-align: center; width: 31.7821%;">₹150–₹180</td> <td style="text-align: center; width: 46.7059%;">Base price</td> </tr> <tr> <td style="text-align: center; width: 21.5566%;">Mid-2024</td> <td style="text-align: center; width: 31.7821%;">₹250–₹280</td> <td style="text-align: center; width: 46.7059%;">+55%</td> </tr> <tr> <td style="text-align: center; width: 21.5566%;">Late 2024</td> <td style="text-align: center; width: 31.7821%;">₹465</td> <td style="text-align: center; width: 46.7059%;">+210%</td> </tr> <tr> <td style="text-align: center; width: 21.5566%;">June 2025</td> <td style="text-align: center; width: 31.7821%;">₹475</td> <td style="text-align: center; width: 46.7059%;">~3x</td> </tr> </tbody> </table> <blockquote> <p> Most current investors (entry ~₹150) are sitting on 3x returns in the unlisted market.</p> </blockquote> <div><hr /></div> <h3>6. IPO Valuation & Peer Comparison</h3> <h4>Expected Valuation</h4> <table style="width: 38.5098%;"> <tbody> <tr> <td style="text-align: center; width: 68.1515%;">Parameter</td> <td style="text-align: center; width: 31.9091%;">Value</td> </tr> <tr> <td style="text-align: center; width: 68.1515%;">Unlisted Market Cap</td> <td style="text-align: center; width: 31.9091%;">₹12,592 Cr</td> </tr> <tr> <td style="text-align: center; width: 68.1515%;">Expected IPO Valuation</td> <td style="text-align: center; width: 31.9091%;">₹13,360 Cr</td> </tr> <tr> <td style="text-align: center; width: 68.1515%;">P/E (FY24)</td> <td style="text-align: center; width: 31.9091%;">~157x</td> </tr> </tbody> </table> <blockquote> <p> If IPO lists above ₹420, short-term listing risk may arise due to high valuation multiples.</p> </blockquote> <h4>Competitive Benchmarking </h4> <table style="width: 87.6474%;"> <tbody> <tr> <td style="text-align: center; width: 22.1462%;">Metric</td> <td style="text-align: center; width: 22.2929%;">Vikram Solar(FY24)</td> <td style="text-align: center; width: 27.4261%;">Premier Energies(FY25)</td> <td style="text-align: center; width: 28.0127%;">Waaree Energies (FY25)</td> </tr> <tr> <td style="text-align: center; width: 22.1462%;">Revenue (₹ Cr)</td> <td style="text-align: center; width: 22.2929%;">2,511</td> <td style="text-align: center; width: 27.4261%;">6,519</td> <td style="text-align: center; width: 28.0127%;">14,444</td> </tr> <tr> <td style="text-align: center; width: 22.1462%;">EBITDA Margin (%)</td> <td style="text-align: center; width: 22.2929%;">10.39%</td> <td style="text-align: center; width: 27.4261%;">27%</td> <td style="text-align: center; width: 28.0127%;">19%</td> </tr> <tr> <td style="text-align: center; width: 22.1462%;">PAT Margin (%)</td> <td style="text-align: center; width: 22.2929%;">3.19%</td> <td style="text-align: center; width: 27.4261%;">14.40%</td> <td style="text-align: center; width: 28.0127%;">13.4%</td> </tr> <tr> <td style="text-align: center; width: 22.1462%;">Debt/Equity</td> <td style="text-align: center; width: 22.2929%;">1.82x</td> <td style="text-align: center; width: 27.4261%;">0.69x</td> <td style="text-align: center; width: 28.0127%;">0.13x</td> </tr> <tr> <td style="text-align: center; width: 22.1462%;">Market Cap (₹ Cr)</td> <td style="text-align: center; width: 22.2929%;">12,592</td> <td style="text-align: center; width: 27.4261%;">47,732</td> <td style="text-align: center; width: 28.0127%;">87,766</td> </tr> <tr> <td style="text-align: center; width: 22.1462%;">P/E Ratio (current)</td> <td style="text-align: center; width: 22.2929%;">157x</td> <td style="text-align: center; width: 27.4261%;">51x</td> <td style="text-align: center; width: 28.0127%;">46.9x</td> </tr> </tbody> </table> <div><hr /></div> <h3>Final Verdict: Should You Invest?</h3> <h4>Strengths:</h4> <ul data-spread="false"> <li> <p>15.5 GW module & 5 GW solar cell capacity planned by FY27</p> </li> <li> <p>Robust export business (₹1,534 Cr to US in FY24)</p> </li> <li> <p>Turnaround in profitability with 6.8x EBITDA growth in two years</p> </li> <li> <p>Leading position in PV module efficiency (up to 23.34%)</p> </li> </ul> <h4>Risks:</h4> <ul data-spread="false"> <li> <p>High client concentration (Top 5 = 76%)</p> </li> <li> <p>Debt levels remain elevated (D/E = 1.81x)</p> </li> <li> <p>IPO may be overvalued at a P/E of 157x based on Fy24 numbers.</p> </li> </ul>
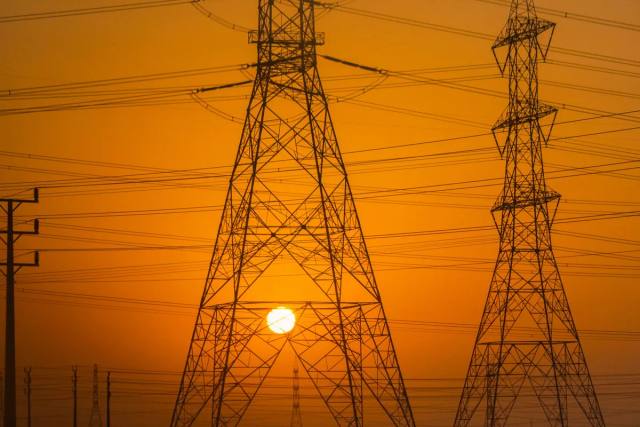
<h3 data-pm-slice="1 1 []">A) Breaking News: 5 GWh Battery Storage Facility Inaugurated in Bengaluru</h3> <p>PACE Digitek Infra Pvt Ltd has taken a monumental step in India’s renewable energy journey with the inauguration of its <strong>5 GWh/year Battery Energy Storage System (BESS)</strong> facility at <strong>Bidadi Industrial Area, Bengaluru</strong>.</p> <p><strong>Inaugurated by:</strong> Union Minister for New & Renewable Energy, <strong>Pralhad Joshi</strong></p> <p><strong>Why It Matters:</strong></p> <ul data-spread="false"> <li> <p>Among the largest BESS facilities in India</p> </li> <li> <p>Supports peak demand management, renewable energy integration, and frequency regulation</p> </li> <li> <p>Aligns with India's <strong>500 GW non-fossil energy target by 2030</strong></p> </li> <li> <p>Positions India as a global manufacturing hub for advanced energy storage systems</p> </li> </ul> <p><strong>Facility Highlights:</strong></p> <ul data-spread="false"> <li> <p><strong>Technology:</strong> Fully automated, cell-to-pack precision assembly line</p> </li> <li> <p><strong>Grid Resilience:</strong> Tackles intermittency in solar/wind energy</p> </li> </ul> <div><hr /></div> <h3>B) Government’s Backing for Energy Storage</h3> <p><strong>Viability Gap Funding (VGF):</strong></p> <ul data-spread="false"> <li> <p>₹5,400 crore for 30 GWh battery storage projects</p> </li> <li> <p>Added to an existing scheme of ₹3,700 crore (13.2 GWh)</p> </li> <li> <p>Total VGF pool now stands at ₹9,100 crore</p> </li> </ul> <p><strong>Future Demand Outlook:</strong></p> <ul data-spread="false"> <li> <p>India’s battery storage demand projected to reach 236 GWh by 2032</p> </li> <li> <p>Total energy storage demand by 2032: 411 GWh</p> </li> <li> <p>Estimated market opportunity: ₹4.79 lakh crore (source: IESA)</p> </li> </ul> <div><hr /></div> <h3>C) PACE Digitek Company Overview</h3> <p> PACE Digitek boasts a market cap of ₹3,837 crore and trades at a share price of ₹215 . The company maintains a P/E ratio of 15.82 and a moderate debt-to-equity ratio of 0.8. It achieved a revenue of ₹2,511 crore, a PAT of ₹242.5 crore (with a net profit margin of 9.66%), and an impressive ROE of 43.69%. The EPS stands at ₹484.92, marking a staggering 1,500% YoY growth.</p> <div><hr /></div> <h3>D) Business Model & Revenue Streams</h3> <p><strong>1. Core Segments:</strong></p> <ul data-spread="false"> <li> <p>Power Management: Telecom tower energy solutions</p> </li> <li> <p>Optical Fiber Laying: Telecom digital infrastructure projects</p> </li> <li> <p>Renewable Energy: Solar and energy storage (BESS)</p> </li> </ul> <p><strong>2. Revenue Mix:</strong></p> <ul data-spread="false"> <li> <p>Product Sales: Power equipment, lithium-ion batteries</p> </li> <li> <p>Project Execution: Government and telecom contracts</p> </li> <li> <p>O&M Services: Recurring income from maintenance</p> </li> </ul> <p><strong>3. Key Clients:</strong></p> <ul data-spread="false"> <li> <p>Telecom: BSNL, Jio, Airtel</p> </li> <li> <p>Government: Rural electrification, Smart City, BharatNet</p> </li> </ul> <p><strong>Market Presence:</strong></p> <ul data-spread="false"> <li> <p>Active in 20+ states across India</p> </li> <li> <p>BESS and solar EPC solutions being adopted in urban and semi-urban areas</p> </li> </ul> <div><hr /></div> <h3>E) Financial Performance Snapshot (FY22–FY24)</h3> <p>PACE Digitek reported a stellar performance in FY24:</p> <ul data-spread="false"> <li> <p>Revenue grew from ₹516 crore in FY23 to ₹2,511 crore in FY24 (a 386% jump)</p> </li> <li> <p>EBITDA surged from ₹35.2 crore to ₹423 crore</p> </li> <li> <p>PAT rose from ₹15.2 crore to ₹242.5 crore</p> </li> <li> <p>Operating Cash Flow improved significantly to ₹371 crore</p> </li> </ul> <p>These figures reflect explosive growth across all financial metrics, with EBITDA and PAT showing over 1,000% YoY improvement.</p> <div><hr /></div> <h3>F) Key Risks & Challenges</h3> <p><strong>Project Delays:</strong> Government or telecom tender delays (e.g., BSNL) can impact revenue timelines.</p> <p><strong>Working Capital Pressure:</strong> FY24 gross current asset days stood at 239, indicating potential liquidity bottlenecks.</p> <p><strong>Revenue Concentration:</strong> Telecom infrastructure still constitutes ~70% of the company’s revenue.</p> <p><strong>Mitigation Strategies:</strong></p> <ul data-spread="false"> <li> <p>Diversification into energy storage and renewable EPC</p> </li> <li> <p>Strategic partnerships and expanded BESS footprint</p> </li> </ul> <div><hr /></div> <h3>G) Growth Drivers & Investment Rationale</h3> <p><strong>Renewable Energy Boom:</strong> India’s battery storage demand is projected to reach 236 GWh by 2032.</p> <p><strong>Government Incentives:</strong> ₹9,100 crore VGF and PLI schemes under Make-in-India are strong enablers.</p> <p><strong>Financial Strength:</strong> ROE at 43.69% and rapidly improving profitability add to investor confidence.</p> <p><strong>First-Mover Advantage:</strong> PACE Digitek is one of the first companies with a large-scale, automated BESS facility in India.</p> <div><hr /></div> <h3> Final Verdict: Is PACE Digitek the Next Multi-Bagger?</h3> <p>PACE Digitek’s sharp pivot toward renewable energy—highlighted by its 5 GWh battery plant—makes it one of the few Indian players positioned at the intersection of energy independence and digital connectivity. While risks remain in execution and sector exposure, its growth in FY24 signals strong fundamentals and execution capability.</p> <p><strong>Bottom Line:</strong> A high-risk, high-reward opportunity in India’s evolving energy-tech space.</p> <div><hr /></div> <p><strong>Disclaimer:</strong> This blog is for informational purposes only. Please consult a certified financial advisor before making any investment decisions.</p>
<h3 data-pm-slice="1 1 []">A) What Makes Raphe mPhilbr’s $100M Funding Round a Turning Point for India’s Defense-Tech?</h3> <p>In a major boost to India’s indigenous defense capabilities, Raphe mPhilbr has secured $100 million<span data-sheets-root="1"> (₹850 crore) in equity funding, led by Silicon Valley-based General Catalyst. With this round, the startup’s post-money valuation has reached $900 million (₹7,650 crore</span>), marking one of the largest capital infusions into an Indian military drone manufacturer to date.</p> <div><hr /></div> <h3>B) Who Is Raphe mPhilbr and What Does It Do?</h3> <p><strong>Founded:</strong> 2017 by brothers Vivek Mishra and Vikash Mishra<br /><strong>Headquarters:</strong> Noida, India<br /><strong>Core Focus:</strong> Design and manufacturing of high-performance military-grade unmanned aerial vehicles (UAVs)</p> <p><strong>Key Offerings:</strong></p> <ul data-spread="false"> <li> <p>Swarm drones for tactical operations</p> </li> <li> <p>High-altitude logistics drones for border deployment</p> </li> <li> <p>Long-range surveillance and maritime patrol UAVs</p> </li> </ul> <div><hr /></div> <h3>C) Financial Snapshot (FY22–FY24)</h3> <h4> </h4> <h4>Balance Sheet Strength</h4> <table style="width: 83.1802%;"> <tbody> <tr> <th style="width: 38.6433%; text-align: center;">Metrics</th> <th style="width: 25.2255%; text-align: center;">FY24 (₹ Cr)</th> <th style="width: 19.3286%; text-align: center;">FY23 (₹ Cr)</th> <th style="width: 16.6311%; text-align: center;">FY22 (₹ Cr)</th> </tr> <tr> <td style="width: 38.6433%; text-align: center;">Long-Term Assets</td> <td style="width: 25.2255%; text-align: center;">63.69</td> <td style="width: 19.3286%; text-align: center;">25.35</td> <td style="width: 16.6311%; text-align: center;">2.75</td> </tr> <tr> <td style="width: 38.6433%; text-align: center;">Long-Term Liabilities</td> <td style="width: 25.2255%; text-align: center;">83.60</td> <td style="width: 19.3286%; text-align: center;">59.11</td> <td style="width: 16.6311%; text-align: center;">6.70</td> </tr> <tr> <td style="width: 38.6433%; text-align: center;">Current Assets</td> <td style="width: 25.2255%; text-align: center;">281.28</td> <td style="width: 19.3286%; text-align: center;">125.08</td> <td style="width: 16.6311%; text-align: center;">34.37</td> </tr> <tr> <td style="width: 38.6433%; text-align: center;">Current Liabilities</td> <td style="width: 25.2255%; text-align: center;">91.25</td> <td style="width: 19.3286%; text-align: center;">49.54</td> <td style="width: 16.6311%; text-align: center;">32.67</td> </tr> <tr> <td style="width: 38.6433%; text-align: center;">Debt-to-Equity Ratio</td> <td style="width: 25.2255%; text-align: center;">0.2</td> <td style="width: 19.3286%; text-align: center;">0.5</td> <td style="width: 16.6311%; text-align: center;">1.3</td> </tr> <tr> <td style="width: 38.6433%; text-align: center;">Current Ratio</td> <td style="width: 25.2255%; text-align: center;">3.1</td> <td style="width: 19.3286%; text-align: center;">2.5</td> <td style="width: 16.6311%; text-align: center;">1.1</td> </tr> </tbody> </table> <h4> </h4> <h4>Profit & Loss Metrics</h4> <table style="width: 67.881%;"> <tbody> <tr> <td style="width: 35.8235%; text-align: center;"><strong>Metrics</strong></td> <td style="width: 21.3946%; text-align: center;"><strong>FY24 (₹ Cr)</strong></td> <td style="width: 21.3946%; text-align: center;"><strong>FY23 (₹ Cr)</strong></td> <td style="width: 21.3946%; text-align: center;"><strong>FY22 (₹ Cr)</strong></td> </tr> <tr> <td style="width: 35.8235%; text-align: center;">Revenue</td> <td style="width: 21.3946%; text-align: center;">83.5</td> <td style="width: 21.3946%; text-align: center;">40.53</td> <td style="width: 21.3946%; text-align: center;">42.53</td> </tr> <tr> <td style="width: 35.8235%; text-align: center;">Gross Margin (%)</td> <td style="width: 21.3946%; text-align: center;">72.4</td> <td style="width: 21.3946%; text-align: center;">81.4</td> <td style="width: 21.3946%; text-align: center;">59.7</td> </tr> <tr> <td style="width: 35.8235%; text-align: center;">EBITDA Margin (%)</td> <td style="width: 21.3946%; text-align: center;">21.8</td> <td style="width: 21.3946%; text-align: center;">18.4</td> <td style="width: 21.3946%; text-align: center;">24.4</td> </tr> <tr> <td style="width: 35.8235%; text-align: center;">PAT Margin (%)</td> <td style="width: 21.3946%; text-align: center;">10.7</td> <td style="width: 21.3946%; text-align: center;">13.1</td> <td style="width: 21.3946%; text-align: center;">34.2</td> </tr> <tr> <td style="width: 35.8235%; text-align: center;">ROE (%)</td> <td style="width: 21.3946%; text-align: center;">2.6</td> <td style="width: 21.3946%; text-align: center;">4.1</td> <td style="width: 21.3946%; text-align: center;">279.3</td> </tr> </tbody> </table> <h4> </h4> <h4>Cash Flow Metrics</h4> <table style="width: 86.7451%;"> <tbody> <tr> <td style="width: 43.5704%; text-align: center;"><strong>Metrics</strong></td> <td style="width: 19.7304%; text-align: center;"><strong>FY24 (₹ Cr)</strong></td> <td style="width: 20.0662%; text-align: center;"><strong>FY23 (₹ Cr)</strong></td> <td style="width: 16.6391%; text-align: center;"><strong>FY22 (₹ Cr)</strong></td> </tr> <tr> <td style="width: 43.5704%; text-align: center;">Operating Cash Flow</td> <td style="width: 19.7304%; text-align: center;">-126.74</td> <td style="width: 20.0662%; text-align: center;">-85.18</td> <td style="width: 16.6391%; text-align: center;">8.70</td> </tr> <tr> <td style="width: 43.5704%; text-align: center;">CAPEX</td> <td style="width: 19.7304%; text-align: center;">-100.69</td> <td style="width: 20.0662%; text-align: center;">-85.83</td> <td style="width: 16.6391%; text-align: center;">-6.03</td> </tr> <tr> <td style="width: 43.5704%; text-align: center;">Financing Cash Flow</td> <td style="width: 19.7304%; text-align: center;">225.62</td> <td style="width: 20.0662%; text-align: center;">169.51</td> <td style="width: 16.6391%; text-align: center;">-0.64</td> </tr> <tr> <td style="width: 43.5704%; text-align: center;">Cash & Cash Equivalents (EOY)</td> <td style="width: 19.7304%; text-align: center;">0.48</td> <td style="width: 20.0662%; text-align: center;">2.31</td> <td style="width: 16.6391%; text-align: center;">3.82</td> </tr> </tbody> </table> <div><hr /></div> <h3>Key Financial Highlights</h3> <ul data-spread="false"> <li> <p><strong>Revenue Surge:</strong> Revenue more than doubled YoY from ₹40.5 Cr in FY23 to ₹83.5 Cr in FY24.</p> </li> <li> <p><strong>Margin Pressure:</strong> Gross margins dipped to 72.4%, likely due to higher production costs or pricing strategies for market penetration.</p> </li> <li> <p><strong>Improved Efficiency:</strong> EBITDA margins improved to 21.8%, showing better operational leverage.</p> </li> <li> <p><strong>Profitability Dip:</strong> PAT margins declined to 10.7%, indicating higher depreciation, R&D, or finance costs.</p> </li> <li> <p><strong>Cash Flow Challenges:</strong> Operating cash flows remain deeply negative due to working capital and CAPEX demands.</p> </li> <li> <p><strong>Debt Reduction:</strong> Debt-to-equity improved significantly to 0.2x, reflecting strong deleveraging.</p> </li> <li> <p><strong>Healthy Liquidity:</strong> With a current ratio of 3.1x, the firm maintains solid short-term solvency.</p> </li> </ul> <div><hr /></div> <h3>D) Why Is This Funding Round So Significant?</h3> <ul data-spread="false"> <li> <p><strong>Largest Equity Round</strong> in the Indian defense drone sector</p> </li> <li> <p><strong>General Catalyst Backing</strong> signals confidence and strategic alignment with global defense-tech leaders like <strong>Anduril</strong> and <strong>Helsing</strong></p> </li> <li> <p><strong>Total Funding Raised to Date:</strong> $118 million</p> </li> </ul> <div><hr /></div> <h3>Strategic Growth Levers</h3> <ol start="1" data-spread="false"> <li> <p><strong>Policy Support:</strong> Beneficiary of India’s 2022 PLI scheme for drones</p> </li> <li> <p><strong>Active Deployment:</strong> Drones already in service with Indian defense forces</p> </li> <li> <p><strong>Export Ambitions:</strong> Aspires to make India a net exporter of next-gen UAVs</p> </li> </ol> <div><hr /></div> <h3>E) Valuation Growth Over Time</h3> <p>In just 12 months, Raphe mPhilbr's valuation jumped 3.6x—from ₹2,125 crore to ₹7,650 crore—driven by four successive funding rounds aggregating ₹1,382.38 crore. The largest valuation leap occurred between September 2024 and March 2025.</p> <table style="width: 53.6215%; height: 91.6665px;"> <tbody> <tr style="height: 18.3333px;"> <td style="width: 25.9174%; text-align: center; height: 18.3333px;"><strong>Date</strong></td> <td style="width: 42.0777%; text-align: center; height: 18.3333px;"><strong>Valuation (₹ Cr)</strong></td> <td style="width: 32.0156%; text-align: center; height: 18.3333px;"><strong>Change (%)</strong></td> </tr> <tr style="height: 18.3333px;"> <td style="width: 25.9174%; text-align: center; height: 18.3333px;">Mar 2024</td> <td style="width: 42.0777%; text-align: center; height: 18.3333px;">2,125</td> <td style="width: 32.0156%; text-align: center; height: 18.3333px;">—</td> </tr> <tr style="height: 18.3333px;"> <td style="width: 25.9174%; text-align: center; height: 18.3333px;">Sep 2024</td> <td style="width: 42.0777%; text-align: center; height: 18.3333px;">3,200</td> <td style="width: 32.0156%; text-align: center; height: 18.3333px;">+50.6%</td> </tr> <tr style="height: 18.3333px;"> <td style="width: 25.9174%; text-align: center; height: 18.3333px;">Mar 2025</td> <td style="width: 42.0777%; text-align: center; height: 18.3333px;">6,800</td> <td style="width: 32.0156%; text-align: center; height: 18.3333px;">+112.5%</td> </tr> <tr style="height: 18.3333px;"> <td style="width: 25.9174%; text-align: center; height: 18.3333px;">Jun 2025</td> <td style="width: 42.0777%; text-align: center; height: 18.3333px;">7,650</td> <td style="width: 32.0156%; text-align: center; height: 18.3333px;">+12.5%</td> </tr> </tbody> </table> <div><hr /></div> <h3>F) Competitive Landscape</h3> <p><strong>Peers:</strong></p> <ul data-spread="false"> <li> <p><strong>IdeaForge</strong> (Listed)</p> </li> <li> <p><strong>Garuda Aerospace</strong></p> </li> <li> <p><strong>Tata Advanced Systems</strong></p> </li> </ul> <p><strong>Industry Catalysts:</strong></p> <ul data-spread="false"> <li> <p>Rising defense budgets post-border tensions</p> </li> <li> <p>Geopolitical shifts fueling demand for indigenous drone capabilities</p> </li> <li> <p>Indian drone startups raised just $8M in the five years prior to this round—highlighting the significance of Raphe’s raise</p> </li> </ul> <div><hr /></div> <h3>G) What’s Ahead for Raphe mPhilbr?</h3> <ul data-spread="false"> <li> <p><strong>Enhancing R&D:</strong> Focus on AI-based autonomy, endurance, and payload efficiency</p> </li> <li> <p><strong>Operational Scaling:</strong> Ramp-up capacity to fulfill both domestic and export orders</p> </li> <li> <p><strong>Defense Sovereignty:</strong> Supports India’s Atmanirbhar Bharat initiative in strategic tech</p> </li> </ul> <div><hr /></div> <h3>Final Thoughts</h3> <p>Raphe mPhilbr’s $100 million funding milestone firmly places it at the forefront of India’s defense-tech evolution. As geopolitical priorities shift and demand for homegrown innovation intensifies, Raphe’s blend of cutting-edge technology, strong government alignment, and investor backing sets a benchmark for what’s possible in India's military-industrial complex.</p> <div><hr /></div> <p><strong>Disclaimer:</strong> This report is for informational purposes only and does not constitute investment advice. Please consult a qualified financial advisor before making any investment decisions.</p>
<p data-pm-slice="1 1 []">India’s startup and enterprise giants are no longer waiting in the wings — they’re heading straight to Dalal Street.</p> <p>A new wave of IPOs is brewing, and it’s not just the usual suspects. Fintech unicorns, logistics disruptors, industrial e-commerce platforms, and even NBFCs are fast-tracking their listing plans. With liquidity flowing, investor sentiment peaking, and valuations soaring, companies are seizing this golden window to go public.</p> <p>So what’s fuelling this IPO frenzy — and who’s at the front of the queue?</p> <div><hr /></div> <h2>A) What’s Behind the IPO Boom?</h2> <ul data-spread="false"> <li> <p><strong>Favorable Market Sentiment:</strong> Lower interest rates and robust credit cycles are creating a ripe environment for equity fundraising.</p> </li> <li> <p><strong>Strong Retail Appetite:</strong> Indian investors are embracing equities like never before — especially in pre-IPO and newly listed names.</p> </li> <li> <p><strong>Ease of Regulations:</strong> With simplified DRHP norms and faster SEBI clearances, the IPO pipeline is moving faster than ever.</p> </li> </ul> <div><hr /></div> <h2>B) NBFCs Gear Up for a Listing Sprint</h2> <p>NBFCs, traditionally slow-moving in the IPO race, are now moving quickly to tap the public markets.</p> <ul data-spread="false"> <li> <p><strong>Why Now?</strong></p> <ul data-spread="false"> <li> <p>Bullish valuations</p> </li> <li> <p>Credit growth resurgence</p> </li> <li> <p>Increased retail participation</p> </li> </ul> </li> <li> <p><strong>What’s Next?</strong></p> <ul data-spread="false"> <li> <p>Multiple NBFCs are working with merchant bankers and could file DRHPs in the coming quarters.</p> </li> </ul> </li> </ul> <div><hr /></div> <h2>C) JSW One Platforms: IPO on the Cards by 2026</h2> <p>JSW One Platforms, the B2B e-commerce venture of the JSW Group, has signaled its IPO intent within the next 18–24 months.</p> <p><strong>At a Glance:</strong></p> <ul data-spread="false"> <li> <p><strong>Parent:</strong> JSW Group</p> </li> <li> <p><strong>Focus:</strong> Industrial & construction material e-commerce</p> </li> <li> <p><strong>Peers:</strong> Zetwerk, Infra Market, O’Business</p> </li> <li> <p><strong>Edge:</strong> Backed by one of India’s largest industrial conglomerates</p> </li> </ul> <div><hr /></div> <h2>D) Shadowfax Targets ₹2,500 Crore IPO</h2> <p>Last-mile delivery startup Shadowfax is readying for a confidential IPO filing.</p> <p><strong>Key Insights:</strong></p> <ul data-spread="false"> <li> <p><strong>Expected Size:</strong> ₹2,000–2,500 crore</p> </li> <li> <p><strong>Breakup:</strong> 50% fresh issue, rest via OFS</p> </li> <li> <p><strong>Use of Funds:</strong> Tech scale-up, geographic expansion, logistics backbone</p> </li> </ul> <p>With India’s logistics market booming, Shadowfax wants to be among the first new-age delivery firms on the bourses.</p> <div><hr /></div> <h2>E) Pine Labs Goes Big: ₹2,600 Crore IPO Incoming</h2> <p>Pine Labs, a payments and credit ecosystem leader, is preparing for one of the most anticipated fintech IPOs of the year.</p> <p><strong>IPO Structure:</strong></p> <ul data-spread="false"> <li> <p><strong>Fresh Issue:</strong> ₹2,600 crore</p> </li> <li> <p><strong>OFS:</strong> 147.8 million shares</p> </li> <li> <p><strong>Major Exits Expected:</strong></p> <ul data-spread="false"> <li> <p>Peak XV</p> </li> <li> <p>Temasek</p> </li> <li> <p>Mastercard</p> </li> <li> <p>PayPal</p> </li> </ul> </li> </ul> <p>This IPO is a milestone not just for Pine Labs, but for India’s fintech ecosystem aiming for global scale and visibility.</p> <div><hr /></div> <h2>F) What It All Means for Investors</h2> <ul data-spread="false"> <li> <p><strong>Momentum Shift:</strong> India’s private market leaders are seeking public validation — and capital.</p> </li> <li> <p><strong>Liquidity Opportunity:</strong> Early investors and VCs are gearing up for major exits.</p> </li> <li> <p><strong>Retail Access:</strong> Savvy retail investors have the chance to participate in India's next tech and infra leaders — right at listing.</p> </li> </ul> <div><hr /></div> <h2>Final Word</h2> <p>From NBFCs to next-gen logistics and payments innovators, India’s IPO engine is roaring. The next 12–18 months could redefine what it means to build — and exit — a business in India's maturing startup ecosystem.</p> <p>Stay tuned to <strong><a href="http://www.unlistedzone.com">UnlistedZone</a> f</strong>or exclusive DRHP breakdowns, pre-IPO deal alerts, and deep-dive financials before the buzz hits the street.</p> <div><hr /></div> <p><strong>Disclaimer:</strong> This post is for educational purposes only and does not constitute investment advice. Always consult your SEBI-registered advisor before investing.</p>


<h3 data-pm-slice="1 1 []">A) What Is NSE's Electricity Futures Fee Waiver All About?</h3> <p>The National Stock Exchange (NSE), India’s largest stock exchange, has launched <strong>electricity futures contracts</strong> to bring efficiency and risk management to India's evolving power market. To kickstart adoption, NSE is offering a <strong>6-month transaction fee waiver</strong> on these contracts.</p> <div><hr /></div> <h3>B) How Does the Fee Waiver Actually Work?</h3> <table style="width: 72.1098%;"> <tbody> <tr> <th style="text-align: center; width: 30.5746%;"><strong>Aspect</strong></th> <th style="text-align: center; width: 69.5194%;"><strong>Details</strong></th> </tr> <tr> <td style="text-align: center; width: 30.5746%;"><strong>Duration</strong></td> <td style="text-align: center; width: 69.5194%;">First 6 months post-launch (until Dec 31, 2025)</td> </tr> <tr> <td style="text-align: center; width: 30.5746%;"><strong>Scope</strong></td> <td style="text-align: center; width: 69.5194%;">Transaction charges waived at exchange level</td> </tr> <tr> <td style="text-align: center; width: 30.5746%;"><strong>Broker Flexibility</strong></td> <td style="text-align: center; width: 69.5194%;">Brokers may choose whether to pass the savings to clients</td> </tr> <tr> <td style="text-align: center; width: 30.5746%;"><strong>Market Comparison</strong></td> <td style="text-align: center; width: 69.5194%;">Competing exchanges charge ₹170-200 for ₹1 crore; NSE: 0%</td> </tr> </tbody> </table> <div> </div> <h3>C) What Are These Electricity Futures?</h3> <ul data-spread="false"> <li> <p><strong>Type:</strong> Monthly cash-settled (no physical delivery)</p> </li> <li> <p><strong>Underlying Index:</strong> Likely based on Day-Ahead Market (DAM) prices or approved power exchange indices</p> </li> <li> <p><strong>Settlement:</strong> Financial, based on benchmark electricity prices</p> </li> </ul> <div><hr /></div> <h3>D) Who Stands to Benefit?</h3> <table style="width: 85.1112%;"> <tbody> <tr> <td style="width: 26.8308%; text-align: center;"><strong>Participant</strong></td> <td style="width: 73.175%; text-align: center;"><strong>Potential Benefit</strong></td> </tr> <tr> <td style="width: 26.8308%; text-align: center;">Discoms</td> <td style="width: 73.175%; text-align: center;">Hedge against volatile electricity prices</td> </tr> <tr> <td style="width: 26.8308%; text-align: center;">Power Generators</td> <td style="width: 73.175%; text-align: center;">Lock in predictable revenue streams</td> </tr> <tr> <td style="width: 26.8308%; text-align: center;">Industries</td> <td style="width: 73.175%; text-align: center;">Manage electricity procurement costs</td> </tr> <tr> <td style="width: 26.8308%; text-align: center;">Traders/Investors</td> <td style="width: 73.175%; text-align: center;">Speculative opportunities without physical delivery</td> </tr> <tr> <td style="width: 26.8308%; text-align: center;">Brokers</td> <td style="width: 73.175%; text-align: center;">Attract new clients if savings are passed on</td> </tr> </tbody> </table> <div> </div> <h3>E) Why Is NSE Making This Move Now?</h3> <ol start="1" data-spread="false"> <li> <p><strong>Build Market Liquidity:</strong> Fee waivers reduce cost barriers for early adopters</p> </li> <li> <p><strong>Diversification:</strong> Helps NSE expand beyond equities and commodities</p> </li> <li> <p><strong>Policy Synergy:</strong> Aligns with India’s goal of creating a unified national electricity market</p> </li> </ol> <div><hr /></div> <h3>F) What Challenges Might Arise?</h3> <ul data-spread="false"> <li> <p><strong>Broker Behavior:</strong> Not all brokers may pass on the benefit to clients</p> </li> <li> <p><strong>Low Initial Participation:</strong> Could limit price discovery and volume</p> </li> <li> <p><strong>Evolving Regulations:</strong> Oversight by CERC may change post-launch</p> </li> </ul> <div><hr /></div> <h3>G) What Could This Mean for India’s Energy Market in the Long Run?</h3> <ul data-spread="false"> <li> <p><strong>Stronger Risk Management:</strong> Discoms and industries gain financial tools to hedge exposure</p> </li> <li> <p><strong>New Product Expansion:</strong> Potential for options and long-duration power contracts</p> </li> <li> <p><strong>Global Benchmarking:</strong> Similar to power futures markets in the US and EU</p> </li> </ul> <div><hr /></div> <h3>Summary Snapshot</h3> <table style="width: 83.7743%;"> <tbody> <tr> <td style="width: 23.3149%; text-align: center;"><strong>Key Highlight</strong></td> <td style="width: 76.6936%; text-align: center;"><strong>Details</strong></td> </tr> <tr> <td style="width: 23.3149%; text-align: center;"><strong>Product</strong></td> <td style="width: 76.6936%; text-align: center;">Monthly electricity futures (cash-settled)</td> </tr> <tr> <td style="width: 23.3149%; text-align: center;"><strong>Fee Waiver</strong></td> <td style="width: 76.6936%; text-align: center;">6-month waiver for exchange transaction charges</td> </tr> <tr> <td style="width: 23.3149%; text-align: center;"><strong>Target Users</strong></td> <td style="width: 76.6936%; text-align: center;">Discoms, Generators, Industries, Traders, Brokers</td> </tr> <tr> <td style="width: 23.3149%; text-align: center;"><strong>Strategic Goal</strong></td> <td style="width: 76.6936%; text-align: center;">Boost participation, support power sector reform</td> </tr> <tr> <td style="width: 23.3149%; text-align: center;"><strong>Next Milestone</strong></td> <td style="width: 76.6936%; text-align: center;">Monitor broker fee behavior and volume post-launch</td> </tr> </tbody> </table> <div><hr /></div> <p><strong>Disclaimer:</strong> This article is intended for informational purposes only and should not be construed as investment advice. Please consult a licensed advisor before making financial decisions.</p> <div><hr /></div>

<p data-pm-slice="1 1 []">Kineco Ltd, a Goa-based leader in advanced composite technology, has hit a significant milestone—<strong>dispatching the 100th Front-End Nose Cone</strong> for the prestigious <strong>Vande Bharat Express</strong>. While this announcement may seem like just another industrial update, it carries deeper meaning for long-term investors eyeing India’s booming infrastructure story.</p> <p>As an essential contributor to India’s flagship semi-high-speed rail initiative, Kineco has established itself as a reliable, high-precision supplier. This milestone is a testament to its capability in executing large-scale government projects and strengthens its long-term investment case in the unlisted space.</p> <div><hr /></div> <h2>A) What Is the Front-End Nose Cone?</h2> <p>The <strong>Nose Cone</strong> is the aerodynamic front portion of the Vande Bharat train, designed to reduce air resistance at high speeds while contributing to the train’s iconic look. Manufactured using advanced composites, these are not only aesthetically critical but also vital for energy efficiency and performance at high velocity.</p> <div><hr /></div> <h2>B) From Design to Dispatch: What This Milestone Signifies</h2> <p>Reaching the 100-unit mark is more than a production statistic; it highlights:</p> <ul data-spread="false"> <li> <p><strong>Kineco’s manufacturing scalability</strong></p> </li> <li> <p><strong>Mastery in composite technologies</strong></p> </li> <li> <p><strong>Operational consistency under Indian Railways’ rigorous specifications</strong></p> </li> <li> <p><strong>Strong alignment with India's transport modernization goals</strong></p> </li> </ul> <p>This achievement puts Kineco among the handful of Indian firms that have successfully industrialized composite technologies at scale for critical national projects.</p> <div><hr /></div> <h2>C) What It Means for Investors</h2> <p>For investors looking at <strong>India’s infrastructure capex boom</strong>, Kineco offers exposure to multiple growth vectors:</p> <h3>1. <strong>Strategic Government Partnerships</strong></h3> <p>Kineco’s relationship with Indian Railways shows trust and delivery record—key markers of long-term viability in government projects.</p> <h3>2. <strong>High-Margin Composite Engineering</strong></h3> <p>Operating in a niche segment of high-performance composites, the company enjoys pricing power and competitive insulation.</p> <h3>3. <strong>Make in India Synergy</strong></h3> <p>This milestone aligns directly with India’s national agenda of self-reliance in high-tech manufacturing, boosting long-term order visibility.</p> <h3>4. <strong>Unlisted Opportunity with Scale Potential</strong></h3> <p>As an unlisted entity, Kineco still offers <strong>valuation headroom</strong>. With 100+ units dispatched, it’s showing proof of execution—a critical risk mitigator in the unlisted space.</p> <div><hr /></div> <h2>D) Rail Capex Boom: The Macro Tailwind</h2> <p>The Indian government’s ongoing investments in rail infrastructure, including 400+ new Vande Bharat trains planned over the next few years, provide long-term demand visibility for suppliers like Kineco.</p> <p>In Budget 2025, Indian Railways received a capex outlay of over ₹2.5 lakh crore—the highest ever. This includes plans for:</p> <ul data-spread="false"> <li> <p>Expansion of semi-high-speed networks</p> </li> <li> <p>Enhanced localization of rail component manufacturing</p> </li> <li> <p>Push for energy-efficient, lightweight trains</p> </li> </ul> <p>Kineco stands to benefit directly from these policy priorities.</p> <div><hr /></div> <h2>E) UnlistedZone Take</h2> <p>Kineco’s latest milestone reinforces its standing in India's high-speed rail journey. For <strong>HNI investors</strong>, <strong>family offices</strong>, and <strong>institutions exploring unlisted equity</strong>, Kineco checks several boxes:</p> <ol start="1" data-spread="false"> <li> <p>Government-approved vendor</p> </li> <li> <p>Execution track record</p> </li> <li> <p> High-growth sector</p> </li> <li> <p> Make in India exposure</p> </li> <li> <p> Advanced manufacturing capabilities</p> </li> </ol> <p>As India moves into the next decade of infra-led growth, companies like Kineco will be at the heart of the transformation—quietly delivering components that power national ambitions.</p> <div><hr /></div> <h2>Final Word</h2> <p>Kineco Ltd may not be a household name yet, but for savvy investors looking beyond IPOs and into high-conviction unlisted opportunities, this milestone is a signal worth tracking.</p> <p><strong>The 100th Nose Cone isn’t just a part of a train—it’s a symbol of precision, execution, and opportunity.</strong></p> <div><hr /></div> <p><strong>Disclaimer:</strong> This article is for informational purposes only and does not constitute investment advice. Always consult with a registered financial advisor before making investment decisions.</p>

<p data-pm-slice="1 1 []">India’s largest stock exchange, the <strong>National Stock Exchange (NSE)</strong>, has taken a bold step toward closing a critical chapter in its regulatory journey. In a move that could potentially clear the path for its long-awaited IPO, NSE has offered a <strong>₹1,388 crore settlement</strong> to the Securities and Exchange Board of India (SEBI) to resolve two high-profile legacy issues — the <strong>co-location</strong> and <strong>dark fibre</strong> cases.</p> <h3>A) What Are These Cases About?</h3> <h4>1. <strong>The Co-Location Controversy (2015)</strong></h4> <p>This case surfaced after a whistleblower alleged that <strong>certain brokers were given preferential access</strong> to NSE’s co-location servers, enabling them to execute trades faster than others — an advantage in high-frequency trading. SEBI’s subsequent investigation confirmed the <strong>unfair access</strong> and raised serious questions about <strong>market integrity and fairness</strong>.</p> <h4>2. <strong>The Dark Fibre Case</strong></h4> <p>This matter involved NSE allowing an <strong>unauthorized vendor (Sampark Infotainment Pvt Ltd)</strong> to install dark fibre — optical fibre lines with minimal latency — for specific brokers. The vendor wasn’t approved by the Department of Telecommunications (DoT), nor was it listed as a recognized NSE service provider.</p> <p>Together, these incidents triggered one of the <strong>biggest regulatory crackdowns</strong> in Indian capital markets history.</p> <div><hr /></div> <h3>B) The ₹1,388 Cr Settlement Proposal</h3> <p>According to filings and internal sources:</p> <ul data-spread="false"> <li> <p><strong>₹1,165 crore</strong> is being offered for the co-location case.</p> </li> <li> <p><strong>₹223 crore</strong> for the dark fibre case.</p> </li> </ul> <p>If SEBI accepts this offer, <strong>pending legal matters in the Supreme Court will be withdrawn</strong>, and NSE’s path to IPO could finally be cleared. This is notably the <strong>highest settlement offer made by any Indian entity to date</strong>.</p> <div><hr /></div> <h3>C) Why Now?</h3> <p>Many of the individuals involved in the violations have exited NSE, reducing the regulatory baggage. NSE has been keen to fast-track its IPO plans, especially after <strong>Tuhin Kanta Pandey took over as SEBI Chairman in February 2025</strong>. This latest move is seen as a final push toward resolving long-pending compliance matters.</p> <div><hr /></div> <h3>D) What Still Needs Resolution?</h3> <p>While the co-location and dark fibre issues are now likely to be closed, SEBI still expects NSE to:</p> <ul data-spread="false"> <li> <p><strong>Upgrade its tech infrastructure</strong>, especially after recent trading system glitches.</p> </li> <li> <p><strong>Strengthen operational governance</strong> to ensure robust market oversight.</p> </li> </ul> <p>These steps are crucial before NSE can get the <strong>regulator’s final green light</strong> for its public offering.</p> <div><hr /></div> <h3>E) What Should Unlisted Investors Take Away?</h3> <p>NSE is <strong>one of the most valuable unlisted companies in India</strong>, with a strong monopoly in the equity trading ecosystem. However, <strong>regulatory overhang has long been a risk factor</strong> for investors. This settlement, if approved, will remove a major hurdle.</p> <h4>✳ Key Implications:</h4> <ul data-spread="false"> <li> <p><strong>Improved listing prospects</strong> in the next 12–18 months.</p> </li> <li> <p>Greater investor confidence post-regulatory cleanup.</p> </li> <li> <p>Sets a precedent for out-of-court settlements in complex SEBI cases.</p> </li> </ul> <div><hr /></div> <p><strong>Disclaimer:</strong> This article is for educational and informational purposes only. It is not a recommendation to buy, sell, or hold any security. Please consult a SEBI-registered advisor before making any investment decisions.</p>
<h2>A) Key IPO Details</h2> <p>With Sebi clearing the DRHP, the proposed ₹17,200-crore Tata Capital IPO moves a step closer to launch. Following Sebi’s approval, Tata Capital is expected to file an updated draft prospectus publicly on the regulator’s website before submitting the final red herring prospectus (RHP) ahead of the IPO launch.</p> <ul data-spread="false"> <li> <p><strong>IPO Size</strong>: ₹17,200 cr (one of India’s largest financial IPOs)</p> </li> <li> <p><strong>Structure</strong>: Fresh issue + Offer for Sale by Tata Sons (93% stake)</p> </li> <li> <p><strong>Valuation Goal</strong>: Up to 1,48,000 cr. </p> </li> <li> <p><strong>Timeline</strong>: SEBI approval in June 2025, RHP expected July, mandatory listing by Sept 2025 per RBI norms</p> </li> </ul> <h2>B) Financial Performance at a Glance</h2> <table style="width: 61.6425%;"> <tbody> <tr> <th style="width: 25.421%; text-align: center;">Metric</th> <th style="width: 21.749%; text-align: center;">FY24</th> <th style="width: 25.9859%; text-align: center;">FY25</th> <th style="width: 26.8332%; text-align: center;">Change</th> </tr> <tr> <td style="width: 25.421%; text-align: center;">Interest Earned</td> <td style="width: 21.749%; text-align: center;">₹16,366 cr</td> <td style="width: 25.9859%; text-align: center;">₹25,720 cr</td> <td style="width: 26.8332%; text-align: center;">+57%</td> </tr> <tr> <td style="width: 25.421%; text-align: center;">Net Profit (PAT)</td> <td style="width: 21.749%; text-align: center;">₹3,327 cr</td> <td style="width: 25.9859%; text-align: center;">₹3,655 cr</td> <td style="width: 26.8332%; text-align: center;">+9.9%</td> </tr> <tr> <td style="width: 25.421%; text-align: center;">Advances</td> <td style="width: 21.749%; text-align: center;">₹1.39 lakh cr</td> <td style="width: 25.9859%; text-align: center;">₹1.98 lakh cr</td> <td style="width: 26.8332%; text-align: center;">+40.7%</td> </tr> <tr> <td style="width: 25.421%; text-align: center;">Gross NPA</td> <td style="width: 21.749%; text-align: center;">1.71%</td> <td style="width: 25.9859%; text-align: center;">2.33%</td> <td style="width: 26.8332%; text-align: center;">↑ Deterioration</td> </tr> <tr> <td style="width: 25.421%; text-align: center;">Net NPA</td> <td style="width: 21.749%; text-align: center;">0.38%</td> <td style="width: 25.9859%; text-align: center;">0.98%</td> <td style="width: 26.8332%; text-align: center;">↑ Deterioration</td> </tr> <tr> <td style="width: 25.421%; text-align: center;">ROE</td> <td style="width: 21.749%; text-align: center;">13.5%</td> <td style="width: 25.9859%; text-align: center;">10.6%</td> <td style="width: 26.8332%; text-align: center;">↓ Pressure</td> </tr> <tr> <td style="width: 25.421%; text-align: center;">Book Value/Share</td> <td style="width: 21.749%; text-align: center;">₹66.43</td> <td style="width: 25.9859%; text-align: center;">₹92.89</td> <td style="width: 26.8332%; text-align: center;">+37.6%</td> </tr> </tbody> </table> <p><em>Highlights:</em></p> <ul data-spread="false"> <li> <p>Strong loan book and interest growth, but PAT and ROE impact due to rising NPAs.</p> </li> </ul> <h2>C) Business Model</h2> <p>Tata Capital is a diversified NBFC offering:</p> <ul data-spread="false"> <li> <p>Consumer: Home, auto, personal loans</p> </li> <li> <p>SME & business loans</p> </li> <li> <p>Housing finance via its subsidiary</p> </li> <li> <p>Cleantech and renewable financing</p> </li> <li> <p>Investment banking through Tata Securities</p> </li> </ul> <h2>D) Risks & Caution Signs</h2> <ul data-spread="false"> <li> <p><strong>Asset Quality</strong>: Higher NPA levels (2.3% gross) on a fast-growing book</p> </li> <li> <p><strong>Debt Load</strong>: Borrowings rose to ~₹1.98 lakh cr</p> </li> <li> <p><strong>Regulatory Deadline</strong>: Must list by Sept 2025 to comply with RBI's NBFC-UL mandate</p> </li> </ul> <h2>E) Peer Benchmarking: Where Tata Capital Stands</h2> <table style="width: 86.5965%; height: 122px;"> <tbody> <tr style="height: 36.9231px;"> <td style="width: 32.9971%; text-align: center; height: 36.9231px;"><strong>Company</strong></td> <td style="width: 14.5998%; text-align: center; height: 36.9231px;"><strong>P/E (x)</strong></td> <td style="width: 14.6055%; text-align: center; height: 36.9231px;"><strong>P/B (x)</strong></td> <td style="width: 18.5576%; text-align: center; height: 36.9231px;"><strong>ROE (%)</strong></td> <td style="width: 19.0731%; text-align: center; height: 36.9231px;"><strong>Market Cap (₹ cr)</strong></td> </tr> <tr style="height: 36.9231px;"> <td style="width: 32.9971%; text-align: center; height: 36.9231px;">Tata Capital (Unlisted)</td> <td style="width: 14.5998%; text-align: center; height: 36.9231px;">~116</td> <td style="width: 14.6055%; text-align: center; height: 36.9231px;">~10.71</td> <td style="width: 18.5576%; text-align: center; height: 36.9231px;">~10.63%</td> <td style="width: 19.0731%; text-align: center; height: 36.9231px;">₹3.88 lakh cr (current) </td> </tr> <tr style="height: 18.4615px;"> <td style="width: 32.9971%; text-align: center; height: 18.4615px;">Bajaj Finance</td> <td style="width: 14.5998%; text-align: center; height: 18.4615px;">34.2</td> <td style="width: 14.6055%; text-align: center; height: 18.4615px;">6.04</td> <td style="width: 18.5576%; text-align: center; height: 18.4615px;">19.2</td> <td style="width: 19.0731%; text-align: center; height: 18.4615px;">₹5.78 lakh cr</td> </tr> <tr style="height: 18.4615px;"> <td style="width: 32.9971%; text-align: center; height: 18.4615px;">L&T Finance</td> <td style="width: 14.5998%; text-align: center; height: 18.4615px;">18.3</td> <td style="width: 14.6055%; text-align: center; height: 18.4615px;">1.92</td> <td style="width: 18.5576%; text-align: center; height: 18.4615px;">~10.8 </td> <td style="width: 19.0731%; text-align: center; height: 18.4615px;">₹49,800 cr</td> </tr> </tbody> </table> <p> <br />Based on unlisted market report as of June 2025.<br /><br />Book value ~₹92.89 /share, P/B ~10.71x<br />ROE implied from FY25 figures is 10.63 <br />Market cap based on ₹1,050 per unlisted share<br />As per Expected Price of 400 per share IN IPO ( Valuation : 1,48,000 cr) </p> <p><strong>What This Means:</strong></p> <ul data-spread="false"> <li> <p>Tata Capital’s implied valuation (P/B ~10.71 x; P/E ~116x) is aggressive due to Unlisted market IPO hype as compared to peers.</p> </li> <li> <p>While Bajaj Finance offers strong returns with lower leverage, Tata must justify its premium valuation through continued scale and brand trust for those who are buying in unlisted.</p> </li> </ul> <h2>F) Journey of Tata Capital</h2> <p><strong>Tata Capital – A Cautionary Tale from the Unlisted Market</strong></p> <p>Tata Capital has been among the most closely tracked names in the unlisted space over the past few years. Its share price witnessed a remarkable rally—from around ₹300 to a peak of ₹1,050 in early 2025—fueled by expectations of a mega IPO, improving financial performance, and extremely limited float in the unlisted market.</p> <p>Investor optimism was largely driven by:</p> <p>• The Tata Group’s strong brand credibility and proven NBFC track record</p> <p>• Hopes of a premium listing, much like Tata Technologies</p> <p>• Steady growth in interest income and Assets Under Management (AUM)</p> <p>Despite repeated advisories from our end highlighting stretched valuations, many investors continued to buy at elevated prices. With the IPO now expected to be priced close to ₹400, those who entered at higher levels in the unlisted market may face significant notional losses.</p> <p>This reinforces the importance of valuation discipline—even for marquee names.</p>

<h2 data-pm-slice="1 1 []"><strong>Introduction</strong></h2> <p>Chennai-based deeptech startup <strong>Fabheads</strong>, founded by former ISRO engineers Dhinesh Kanagaraj and Abhijeet Rathore, has raised $10 million in its <strong>Series A funding round</strong>, led by <strong>Accel</strong> with participation from <strong>Trifecta Capital</strong>. This funding brings the company's total capital raised to $13 million, including $3 million from seed and pre-seed rounds in 2021.</p> <div><hr /></div> <h3>Company Overview: Pioneering Composite Manufacturing</h3> <p><strong>Founded:</strong> 2015<br /><strong>Founders:</strong> Dhinesh Kanagaraj and Abhijeet Rathore (ex-ISRO)<br /><strong>Headquarters:</strong> Chennai, India<br /><strong>Expansion Plans:</strong> New facility in Bengaluru targeting aerospace applications</p> <p>Fabheads specializes in <strong>robotic automation systems for composite fiber manufacturing</strong>, a rapidly evolving area with applications in aerospace, mobility, defense, and clean energy sectors.</p> <div><hr /></div> <h3>Technology Edge: Revolutionizing Composites with Robotics</h3> <p>Fabheads’ proprietary technology focuses on automating composite manufacturing, delivering:</p> <ul data-spread="false"> <li> <p><strong>Up to 50% cost savings</strong></p> </li> <li> <p><strong>20% reduction in material waste</strong></p> </li> <li> <p><strong>30% improvement in production cycles</strong></p> </li> </ul> <p>This high degree of automation addresses key pain points in traditional composite manufacturing, making the process more efficient, scalable, and environmentally sustainable.</p> <div><hr /></div> <h3>Utilization of Funds: Fueling Next-Phase Growth</h3> <p>The newly raised funds will be utilized for:</p> <ul data-spread="false"> <li> <p><strong>Scaling manufacturing capacity</strong></p> </li> <li> <p><strong>Hiring across leadership, engineering, and R&D</strong></p> </li> <li> <p><strong>Establishing a new aerospace-focused facility in Bengaluru</strong>, expected to be operational within six months</p> </li> </ul> <div><hr /></div> <h3>Market Outlook: A High-Growth Sector Backed by Policy</h3> <p>The composite materials market is witnessing robust demand, especially in sectors that demand lightweight, high-strength materials.</p> <ul data-spread="false"> <li> <p><strong>Market Size:</strong> $1.8 billion in 2024 (India)</p> </li> <li> <p><strong>Projected Growth:</strong> Expected to reach $2.6–$2.8 billion by 2030</p> </li> <li> <p><strong>CAGR:</strong> 7.8%</p> </li> </ul> <p><strong>Government Support:</strong></p> <ul data-spread="false"> <li> <p>Push for <strong>carbon fiber production</strong></p> </li> <li> <p>Promotion of <strong>technical textile exports</strong>, targeting <strong>$10 billion by 2030</strong></p> </li> </ul> <div><hr /></div> <h3>Leadership Commentary</h3> <p><strong>Dhinesh Kanagaraj</strong>, CEO of Fabheads:</p> <blockquote> <p>"Our mission is to make advanced composite technologies accessible across industries globally. Fabheads remains India’s only specialized provider of such robotics-driven solutions."</p> </blockquote> <p><strong>Prayank Swaroop</strong>, Partner at Accel:</p> <blockquote> <p>"Fabheads is uniquely positioned to solve core manufacturing bottlenecks in sectors poised for rapid expansion. We are excited to partner with them on this journey."</p> </blockquote> <div><hr /></div> <h3>Strategic Significance</h3> <p>Fabheads’ technology-driven model and government-aligned growth strategy place it at the center of India's emerging composite manufacturing ecosystem. Its upcoming Bengaluru facility signals an aggressive pivot toward aerospace, positioning it as a leader in deeptech manufacturing innovation.</p> <div><hr /></div> <h3>Summary Chart: Fabheads at a Glance</h3> <table style="width: 41.5457%;"> <tbody> <tr> <th style="text-align: center; width: 45.4505%;">Key Metric</th> <th style="text-align: center; width: 54.6428%;">Details</th> </tr> <tr> <td style="text-align: center; width: 45.4505%;"><strong>Startup Name</strong></td> <td style="text-align: center; width: 54.6428%;">Fabheads</td> </tr> <tr> <td style="text-align: center; width: 45.4505%;"><strong>Funding Round</strong></td> <td style="text-align: center; width: 54.6428%;">Series A</td> </tr> <tr> <td style="text-align: center; width: 45.4505%;"><strong>Amount Raised</strong></td> <td style="text-align: center; width: 54.6428%;">$10 million</td> </tr> <tr> <td style="text-align: center; width: 45.4505%;"><strong>Total Funding</strong></td> <td style="text-align: center; width: 54.6428%;">$13 million</td> </tr> <tr> <td style="text-align: center; width: 45.4505%;"><strong>Founded</strong></td> <td style="text-align: center; width: 54.6428%;">2015</td> </tr> <tr> <td style="text-align: center; width: 45.4505%;"><strong>Founders</strong></td> <td style="text-align: center; width: 54.6428%;">Dhinesh Kanagaraj, Abhijeet Rathore</td> </tr> <tr> <td style="text-align: center; width: 45.4505%;"><strong>Tech Focus</strong></td> <td style="text-align: center; width: 54.6428%;">Robotic composite fiber manufacturing</td> </tr> <tr> <td style="text-align: center; width: 45.4505%;"><strong>Use of Funds</strong></td> <td style="text-align: center; width: 54.6428%;">Scale, hire, Bengaluru facility</td> </tr> <tr> <td style="text-align: center; width: 45.4505%;"><strong>Sector</strong></td> <td style="text-align: center; width: 54.6428%;">Aerospace, Mobility, Clean Energy, Defense</td> </tr> <tr> <td style="text-align: center; width: 45.4505%;"><strong>Growth Rate (CAGR)</strong></td> <td style="text-align: center; width: 54.6428%;">7.8% (2024–2030 India composites market)</td> </tr> </tbody> </table> <div><hr /></div> <p><strong>Conclusion</strong></p> <p>With cutting-edge robotic automation for composites, Fabheads is positioned to lead a new era in advanced manufacturing. Its recent funding round not only validates its vision but also empowers the team to scale operations, expand R&D, and fuel India’s ambitions in deeptech manufacturing.</p>

<p data-pm-slice="1 1 []"><strong>Introduction</strong></p> <p>In a significant pre-IPO development, <strong>Zerodha co-founders Nikhil and Nithin Kamath</strong> have invested <strong>₹250 crore</strong> in <strong>InCred Holdings Limited</strong>, the parent company of <strong>InCred Financial Services</strong>. This investment is part of InCred’s broader strategy to raise capital ahead of its proposed <strong>₹4,000–5,000 crore IPO</strong>, targeting a valuation between <strong>₹15,000–22,500 crore</strong>.</p> <div><hr /></div> <h3>A) About InCred Group: A Diversified Fintech Powerhouse</h3> <p><strong>Founded:</strong> 2016<br /><strong>Founder:</strong> Bhupinder Singh<br /><strong>Unicorn Status:</strong> Achieved in 2023 after a $60 million fundraise<br /><strong>Headquarters:</strong> Mumbai, India</p> <p>InCred operates across three major financial verticals:</p> <ol start="1" data-spread="false"> <li> <p><strong>InCred Finance:</strong> Non-Banking Financial Company (NBFC), which merged with <strong>KKR India Financial Services</strong> in 2022.</p> </li> <li> <p><strong>InCred Capital:</strong> Institutional and wealth management platform.</p> </li> <li> <p><strong>InCred Money:</strong> Digital-first retail investment and broking platform.</p> </li> </ol> <div><hr /></div> <h3>B) Financial Highlights (FY2025)</h3> <table style="width: 65.95%;"> <tbody> <tr> <th style="text-align: center; width: 39.7562%;">Metric</th> <th style="text-align: center; width: 60.2517%;">Value</th> </tr> <tr> <td style="text-align: center; width: 39.7562%;"><strong>Revenue</strong></td> <td style="text-align: center; width: 60.2517%;">₹1,267 crore (YoY growth of 48%)</td> </tr> <tr> <td style="text-align: center; width: 39.7562%;"><strong>Profit After Tax (PAT)</strong></td> <td style="text-align: center; width: 60.2517%;">₹316 crore</td> </tr> <tr> <td style="text-align: center; width: 39.7562%;"><strong>Loan Book</strong></td> <td style="text-align: center; width: 60.2517%;">₹10,000+ crore</td> </tr> </tbody> </table> <p>These strong financials underscore the group’s rapid scale and profitability in India’s expanding credit ecosystem.</p> <div><hr /></div> <h3>C) Strategic Moves: Building an Integrated Fintech Ecosystem</h3> <p><strong>1. Entry into Retail Broking</strong></p> <ul data-spread="false"> <li> <p><strong>Acquisition:</strong> InCred Money acquired <strong>South Asian Stocks Limited (SASL)</strong>.</p> </li> <li> <p><strong>Rebranding:</strong> The acquired entity will be relaunched as <strong>InCred Stocko</strong> after regulatory approvals. This move integrates a <strong>discount broking platform</strong> into its digital investment suite.</p> </li> </ul> <p><strong>2. Expansion in Secured Lending</strong></p> <ul data-spread="false"> <li> <p><strong>Gold Loan Acquisition:</strong> InCred acquired the <strong>gold loan portfolio of TruCap Finance</strong> via a slump sale, enhancing its secured lending footprint.</p> </li> </ul> <div><hr /></div> <h3>D) Kamath Brothers’ Investment: A Vote of Confidence</h3> <p>The Kamath brothers' ₹250 crore investment reflects growing investor confidence in InCred’s:</p> <ul data-spread="false"> <li> <p><strong>Tech-first approach</strong> to credit and wealth management</p> </li> <li> <p><strong>Disciplined underwriting and scalability</strong></p> </li> <li> <p><strong>Ability to integrate diversified financial products</strong> under one roof</p> </li> </ul> <p><strong>Nikhil Kamath</strong> commented:</p> <blockquote> <p>"We view InCred as a rare combination of tech-enabled scalability and lending fundamentals. It is a bet on responsible credit growth in India."</p> </blockquote> <div><hr /></div> <h3>E) IPO Plans: Positioning for the Public Markets</h3> <table> <tbody> <tr> <td>IPO Metric</td> <td>Estimate</td> </tr> <tr> <td><strong>Issue Size</strong></td> <td>₹4,000–5,000 crore</td> </tr> <tr> <td><strong>Expected Valuation</strong></td> <td>₹15,000–22,500 crore</td> </tr> <tr> <td><strong>IPO Timeline</strong></td> <td>Likely in the next 12–18 months</td> </tr> </tbody> </table> <p>The IPO is expected to provide an exit opportunity for early investors while unlocking fresh capital for growth and technology investments.</p> <div><hr /></div> <h3>F) Market Outlook: Riding India’s Digital Credit Boom</h3> <p>India’s financial services sector is undergoing a structural transformation, led by:</p> <ul data-spread="false"> <li> <p><strong>Rising demand</strong> for digital credit products</p> </li> <li> <p><strong>Wider fintech adoption</strong> across urban and semi-urban segments</p> </li> <li> <p><strong>Policy push</strong> for financial inclusion and NBFC strengthening</p> </li> </ul> <p>InCred’s full-stack approach, combined with strategic acquisitions and marquee investor backing, positions it as a leading contender in India’s next generation of listed fintech giants.</p> <div><hr /></div> <h3>Concise Summary Chart</h3> <table style="width: 57.4835%;"> <tbody> <tr> <td style="width: 37.9551%; text-align: center;">Category</td> <td style="width: 62.0536%; text-align: center;">Highlights</td> </tr> <tr> <td style="width: 37.9551%; text-align: center;"><strong>Investment</strong></td> <td style="width: 62.0536%; text-align: center;">₹250 Cr by Kamath Brothers</td> </tr> <tr> <td style="width: 37.9551%; text-align: center;"><strong>FY25 PAT</strong></td> <td style="width: 62.0536%; text-align: center;">₹316 Cr</td> </tr> <tr> <td style="width: 37.9551%; text-align: center;"><strong>Loan Book</strong></td> <td style="width: 62.0536%; text-align: center;">₹10,000+ Cr</td> </tr> <tr> <td style="width: 37.9551%; text-align: center;"><strong>IPO Size</strong></td> <td style="width: 62.0536%; text-align: center;">₹4,000–5,000 Cr</td> </tr> <tr> <td style="width: 37.9551%; text-align: center;"><strong>Valuation Target</strong></td> <td style="width: 62.0536%; text-align: center;">₹15,000–22,500 Cr</td> </tr> </tbody> </table> <div><hr /></div> <h3>Journey of InCred in Unlisted Market</h3> <ul data-spread="false"> <li> <p><strong>2022</strong>: Merged with KKR India Financial Services to strengthen lending capacity.</p> </li> <li> <p><strong>2023</strong>: Achieved unicorn status after raising $60 million from marquee investors.</p> </li> <li> <p><strong>2024</strong>: Entered retail broking with acquisition of Stocko and expanded into gold loans through TruCap deal.</p> </li> <li> <p><strong>2025</strong>: Attracted ₹250 Cr investment from Kamath brothers ahead of ₹5,000 Cr IPO.</p> </li> </ul> <p> </p> <div><hr /></div> <h3>UnlistedZone Takeaway</h3> <p>InCred has evolved into one of India’s most well-rounded fintech platforms, integrating lending, wealth management, and digital broking. The Kamath brothers’ substantial backing signals high conviction in its long-term potential. With a ₹10,000+ crore loan book and strong financials, InCred is well-positioned for a high-impact IPO in a market ripe for next-gen NBFCs.</p> <p>Stay tuned to <strong>UnlistedZone</strong> for exclusive updates on InCred and the broader unlisted market space.</p>
Indicative prices, company research and your enquiries — in your pocket. Get price notes on the names you follow and reach our team from anywhere.


