If you had asked most investors a decade ago to pick the future giants of the mutual fund industry, a value-oriented boutique from Mumbai with just one flagship scheme probably wouldn’t have made the list.
Yet Parag Parikh Financial Advisory Services (PPFAS) has quietly moved into the big league.
Its mutual fund arm now manages well over ₹1.3 lakh crore of AUM as of September 2025, up from around ₹68,000 crore in March 2024 and ₹1.06 lakh crore in March 2025.
And in the unlisted market, the parent company is being valued at roughly ₹13,045 crore.
So the natural questions are:
-
What exactly is the PPFAS business model?
-
How do the latest H1 FY26 numbers look versus H1 FY25?
-
And at today’s unlisted valuation, how does it stack up against listed giants like HDFC AMC and Nippon Life India AMC?
Let’s break it down.
1. How does PPFAS make money?
Think of PPFAS as a fee-collecting machine sitting on top of one big thing: Assets Under Management (AUM).
The core engine – AMC fees
PPFAS runs a small but focused set of schemes – Flexi Cap, ELSS, Liquid, Conservative Hybrid, Arbitrage and Dynamic Asset Allocation.
Every rupee in these schemes is charged an expense ratio.
Out of that, a slice (the investment management fee) flows to the AMC – PPFAS Asset Management Pvt Ltd, which sits inside the listed parent, Parag Parikh Financial Advisory Services Ltd.
So when:
AUM rises, and fee income compounds automatically.
The other leg – treasury income
PPFAS also earns:
-
Interest income on its own surplus cash, and
-
Gains on its proprietary investments (“net gain on fair value changes” in the P&L).
This gives it a second profit engine, but the core story is still AUM-linked fees.
In short: it’s an asset-light, high-operating-leverage business – if AUM grows faster than costs, profits can scale disproportionately.
2. H1 FY26 vs H1 FY25 – the numbers in plain English
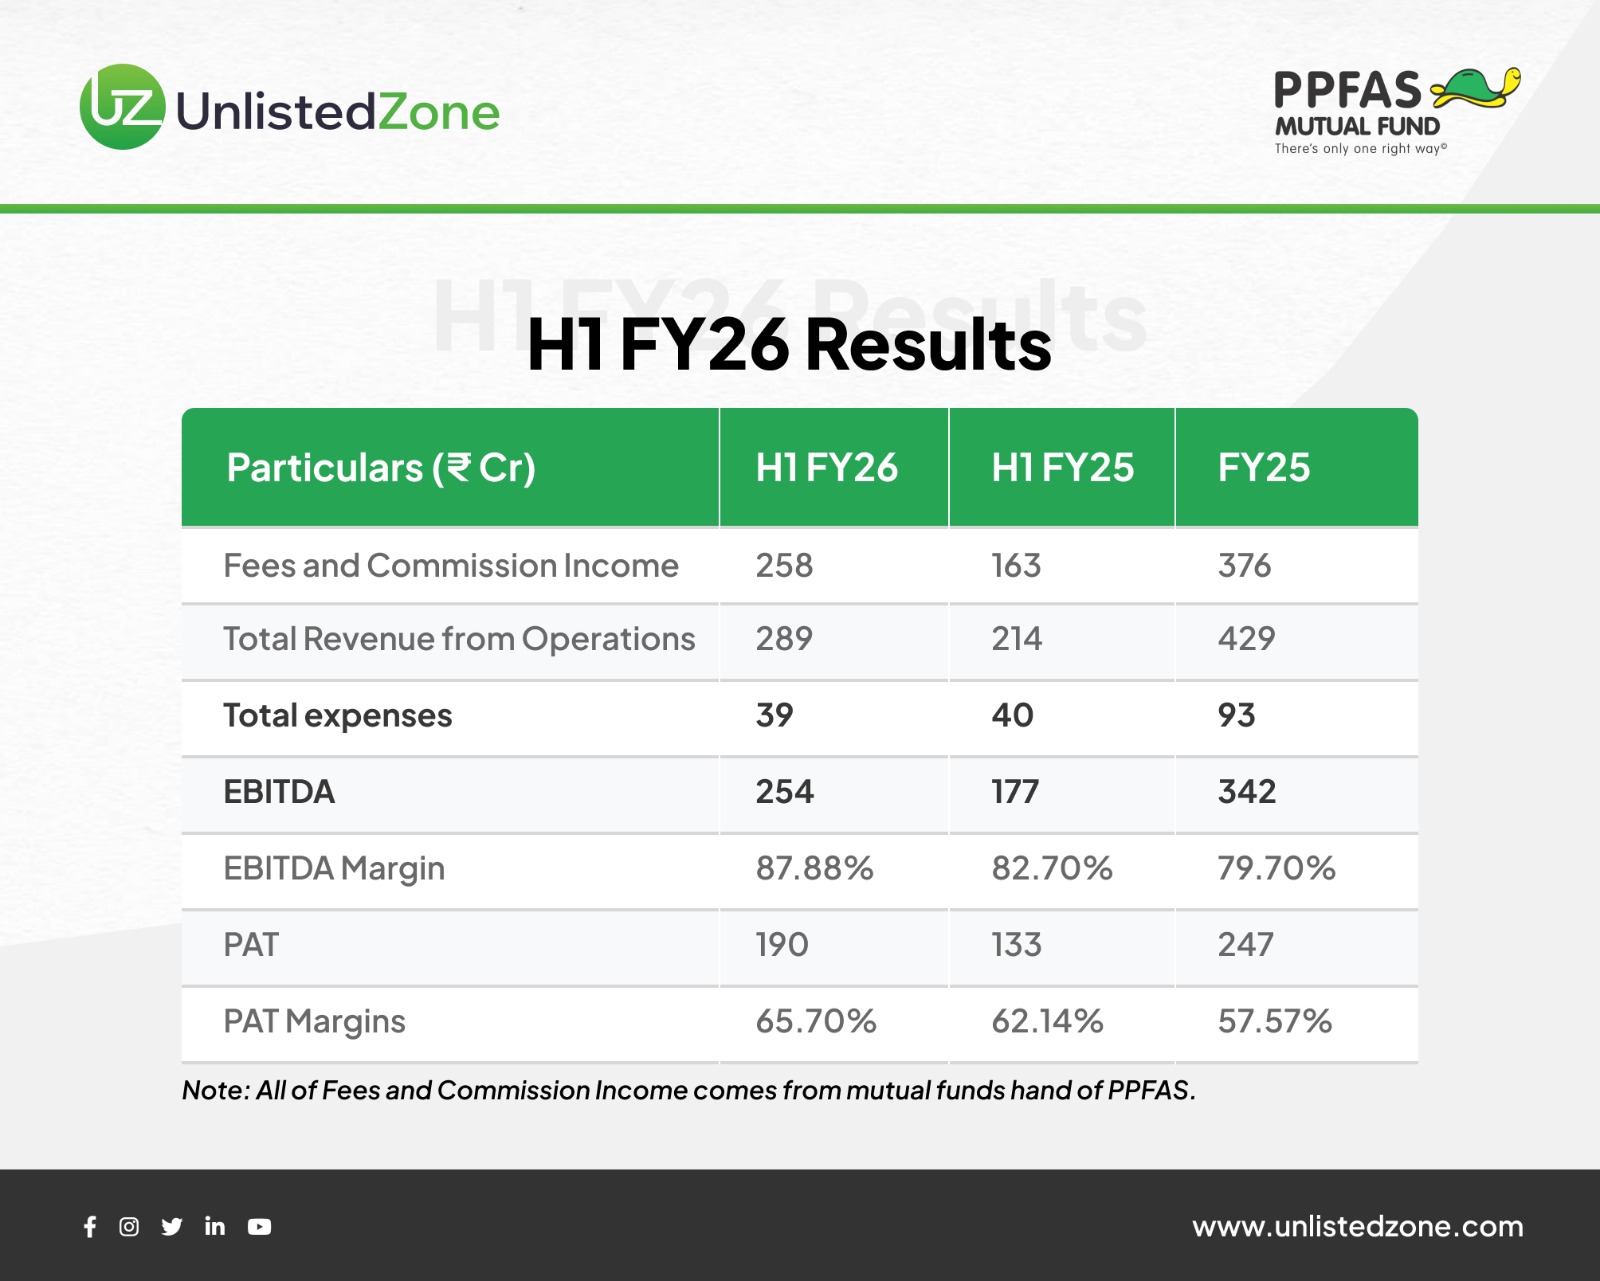
(All numbers consolidated, in ₹ crore, converted from lakhs.)
Top line: strong double-digit growth
-
Revenue from operations
-
H1 FY26: ~₹289 cr
-
H1 FY25: ~₹214 cr
-
Growth: ~35% YoY
This is broadly in line with the AUM jump between FY24 and FY25 and the continued scale-up into FY26.
Costs: rising, but under control
Expenses (finance cost + employee + depreciation + other operating costs) together came to roughly:
-
H1 FY26: ₹39 cr
-
H1 FY25: ₹40 cr
In other words, revenue grew ~35%, while total expenses were flat to slightly lower.
That’s classic operating leverage at work.
Profitability: margins expanding
So even though H1 FY26 hasn’t seen an extraordinary market melt-up, PPFAS has managed to translate higher AUM and tight cost control into very healthy earnings growth.
3. Cash flows – are the profits real?
Always a key question for any AMC.
From the consolidated cash-flow statement:
CFO has grown much faster than reported PAT, implying strong working-capital discipline (receivables, payables, etc.).
Investing and financing cash flows are largely around deployment of surplus funds and routine items – there’s no sign of aggressive capex or leveraged bets.
Bottom line: PPFAS is not just booking accounting profits; those profits are also converting into cash.
4. Valuation maths – what does ₹13,045 crore imply?
You mentioned an implied unlisted market cap of ₹13,045 crore.
Let’s translate that into basic valuation ratios.
a) Implied P/E
Annualising the latest half-year PAT:
So:
P/E ≈13,045/380 ≈34.32×
Implied P/E ≈ 34–36x at FY26E earnings.
b) Market-cap to AUM
Mcap/AUM ≈ 13,045/1,36,757 ≈ 0.10×
So the market is valuing PPFAS at roughly 10% of its AUM.
5. How does PPFAS stack up against listed AMCs?
Let’s put it next to the big boys.
HDFC AMC
Nippon Life India AMC
PPFAS (unlisted, implied)
-
Market cap (unlisted): ₹13,045 cr
-
AUM (Sept 2025): ₹1.37 lakh cr
-
Mcap/AUM: ≈ 10%
-
P/E (annualised FY26E): ≈ 34–36x
Reading this table in simple terms:
-
On P/E, PPFAS is cheaper than HDFC AMC, and somewhat below Nippon AMC, despite faster AUM and profit growth from a smaller base.
-
On Mcap/AUM, it sits between Nippon and HDFC – not “dirt cheap”, but not in bubble territory either, given its boutique positioning and high-quality retail franchise.
6. What makes PPFAS different from the big AMCs?
A few structural nuances:
-
Concentrated product suite
-
PPFAS doesn’t run dozens of me-too schemes.
-
Most of its AUM sits in the Parag Parikh Flexi Cap Fund, which follows a value-plus-quality style, often with global exposure.
-
Retail, SIP-heavy franchise
-
Growth has been driven by retail SIPs, especially from digitally aware, long-term investors and Tier-2/3 cities.
-
This kind of money tends to be stickier in corrections, which helps earnings stability.
-
Owner-operator culture
-
High operating leverage ahead
7. UnlistedZone’s view
Putting it all together:
-
Business quality:
PPFAS is now a serious mid-tier AMC with a strong brand among long-term equity investors, a SIP-driven book and a clean balance sheet.
-
Growth:
AUM has nearly doubled in 18 months, and H1 FY26 PAT is up ~43% YoY. AUM growth may moderate from here, but the franchise has enough momentum to keep compounding if markets cooperate.
-
Cash generation:
Operating cash flow tracks profit reasonably well, which we like. This is not a story built on aggressive accounting.
-
Valuation:
At an implied 34–36x FY26E P/E and ~10% Mcap/AUM, PPFAS is:
-
More expensive than Nippon on AUM basis,
-
Cheaper than HDFC AMC on both P/E and Mcap/AUM,
-
And priced as a premium, fast-growing boutique, not as a bargain deep-value bet.
For investors in the unlisted space, PPFAS looks like a quality compounding story rather than a quick re-rating trade. The upside will primarily depend on:
-
Whether AUM can keep compounding at a healthy double-digit rate, and
-
Whether margins stay high even as the industry faces regulatory pressure on fees.
As always, this is not a recommendation. In the unlisted market, liquidity is thin, execution is harder, and entry/exit spreads can be wide. Anyone considering PPFAS should:
-
Treat this as a long-horizon, high-quality equity bet,
-
Stress-test valuations against a weaker market or slower AUM growth, and
-
Size positions conservatively, keeping overall portfolio risk in mind.
Disclaimer:
UnlistedZone is not a SEBI-registered Research Analyst or Investment Advisor. All information provided on our platform is strictly for educational and informational purposes. We do not offer investment advice or stock recommendations. Investors are advised to conduct their own due diligence or consult a SEBI-registered advisor. Investments in unlisted and pre-IPO shares are subject to market risks including illiquidity and volatility. UnlistedZone does not assure any returns or accept liability for investment outcomes based on this report.