Analysis, guides and explainers on India's unlisted market — from IPO pipelines to ESOP liquidity.
<p data-pm-slice="1 1 []"><strong>1. NSE vs BSE – Comparative Financial Analysis (FY25)</strong></p> <table style="width: 56.8211%;"> <tbody> <tr> <th style="width: 53.3409%; text-align: center;"><strong>Metric</strong></th> <th style="width: 29.4779%; text-align: center;"><strong>NSE</strong></th> <th style="width: 17.0784%; text-align: center;"><strong>BSE</strong></th> </tr> <tr style="text-align: center;"> <td style="width: 53.3409%;"><strong>FY25 Revenue from Ops</strong></td> <td style="width: 29.4779%;">₹17,141 Cr</td> <td style="width: 17.0784%;">₹2,957 Cr</td> </tr> <tr style="text-align: center;"> <td style="width: 53.3409%;"><strong>FY25 Total Income</strong></td> <td style="width: 29.4779%;">₹19,177 Cr</td> <td style="width: 17.0784%;">₹3,236 Cr</td> </tr> <tr style="text-align: center;"> <td style="width: 53.3409%;"><strong>FY25 PAT</strong></td> <td style="width: 29.4779%;">₹12,188 Cr</td> <td style="width: 17.0784%;">₹1,328 Cr</td> </tr> <tr style="text-align: center;"> <td style="width: 53.3409%;"><strong>EPS (FY25)</strong></td> <td style="width: 29.4779%;">₹49.24</td> <td style="width: 17.0784%;">₹96.55</td> </tr> <tr style="text-align: center;"> <td style="width: 53.3409%;"><strong>PAT Margin</strong></td> <td style="width: 29.4779%;">63.55%</td> <td style="width: 17.0784%;">41.00%</td> </tr> <tr style="text-align: center;"> <td style="width: 53.3409%;"><strong>Dividend (FY25)</strong></td> <td style="width: 29.4779%;">₹35/share</td> <td style="width: 17.0784%;">₹23/share</td> </tr> <tr style="text-align: center;"> <td style="width: 53.3409%;"><strong>Dividend Yield (on CMP)</strong></td> <td style="width: 29.4779%;">2.12%</td> <td style="width: 17.0784%;">0.34%</td> </tr> </tbody> </table> <div style="text-align: center;"><hr /></div> <p style="text-align: left;"><strong>2. YoY Growth (FY24 vs FY25)</strong></p> <table style="width: 61.9976%;"> <tbody> <tr> <td style="width: 28.3452%; text-align: center;"><strong>Metric</strong></td> <td style="width: 45.6337%; text-align: center;"><strong>NSE YoY Growth</strong></td> <td style="width: 26.1338%; text-align: center;"><strong>BSE YoY Growth</strong></td> </tr> <tr> <td style="width: 28.3452%; text-align: center;"><strong>Revenue Growth</strong></td> <td style="width: 45.6337%; text-align: center;">16%</td> <td style="width: 26.1338%; text-align: center;">115.7%</td> </tr> <tr> <td style="width: 28.3452%; text-align: center;"><strong>PAT Growth</strong></td> <td style="width: 45.6337%; text-align: center;">47%</td> <td style="width: 26.1338%; text-align: center;">70%</td> </tr> <tr> <td style="width: 28.3452%; text-align: center;"><strong>EPS Growth</strong></td> <td style="width: 45.6337%; text-align: center;">From ₹33.56 to ₹49.24</td> <td style="width: 26.1338%; text-align: center;">From ₹56.66 to ₹96.55</td> </tr> </tbody> </table> <blockquote> <p style="text-align: left;">⚠️ BSE’s massive jump in revenue and PAT is due to expanded derivative products and one-time SGF fund adjustments with SEBI approval.</p> </blockquote> <div><hr /></div> <p><strong>3. Valuation Comparison (As on FY25 & FY26E)</strong></p> <table style="width: 63.3218%; height: 91.6666px;"> <tbody> <tr style="height: 18.3333px;"> <td style="width: 36.5406%; height: 18.3333px; text-align: center;"><strong>Parameter</strong></td> <td style="width: 27.395%; height: 18.3333px; text-align: center;"><strong>NSE</strong></td> <td style="width: 35.9802%; height: 18.3333px; text-align: center;"><strong>BSE</strong></td> </tr> <tr style="height: 18.3333px;"> <td style="width: 36.5406%; height: 18.3333px; text-align: center;"><strong>Market Cap (Approx.)</strong></td> <td style="width: 27.395%; height: 18.3333px; text-align: center;">₹4,08,000 Cr</td> <td style="width: 35.9802%; height: 18.3333px; text-align: center;">₹90,000 Cr</td> </tr> <tr style="height: 18.3333px;"> <td style="width: 36.5406%; height: 18.3333px; text-align: center;"><strong>P/E Ratio (FY25)</strong></td> <td style="width: 27.395%; height: 18.3333px; text-align: center;">33.5x</td> <td style="width: 35.9802%; height: 18.3333px; text-align: center;">68x</td> </tr> <tr style="height: 36.6667px;"> <td style="width: 36.5406%; height: 36.6667px; text-align: center;"><strong>P/E Ratio (FY26E)</strong></td> <td style="width: 27.395%; height: 36.6667px; text-align: center;">37x (Estimated PAT ₹11,000 Cr)</td> <td style="width: 35.9802%; height: 36.6667px; text-align: center;">45x (Estimated PAT ₹2,000 Cr)</td> </tr> </tbody> </table> <p><span style="text-decoration: underline;"><strong>BSE:</strong></span><br /><br /><strong>Q4FY25</strong> - Revenue is INR <strong>846 cr</strong> and PAT is INR <strong>492 Cr</strong>. So, if we annualise this for FY26E , revenue would be ~INR 3400 cr and PAT of ~INR 2000 Cr. Current Mcap is <strong>INR 90000 cr.</strong><br /><br /><strong>P/E based on FY26E would be 45x</strong>.</p> <p><span style="text-decoration: underline;"><strong>NSE:</strong></span><br /><br /><strong>Q4FY25</strong> - Revenue is INR 3771 cr and PAT is INR 2650 Cr. So, if we annualise this for FY26E, revenue would be <strong>~INR 15000 cr</strong> and PAT of <strong>~11000 Cr.</strong> <strong>Current Mcap is 4,08,000 cr.</strong><br /><br /><strong>P/E based on FY26E would be 37x</strong>.</p> <div><hr /></div> <p><strong>4. Key Observations</strong></p> <p><strong>NSE</strong>:</p> <ul data-spread="false"> <li> <p>Continues to <strong>dominate in scale</strong>, with >5x revenue and >9x PAT compared to BSE.</p> </li> <li> <p>Strong profitability and dividend yield (2.12%) attract institutional investors.</p> </li> <li> <p>Q4 FY25 witnessed a <strong>QoQ decline</strong> in both revenue and PAT, due to reduced trading volumes or market activity after SEBI restricted the weekly expiry to one per exchange.</p> </li> </ul> <p><strong>BSE</strong>:</p> <ul data-spread="false"> <li> <p><strong>Revenue grew 2x YoY</strong>, thanks to success in the <strong>Sensex/Bankex derivatives</strong>, and increased transaction charges.</p> </li> <li> <p>EPS and PAT saw strong YoY growth; PAT margins expanded to 53% in Q4 FY25.</p> </li> <li> <p>Trades at a <strong>higher P/E due to growth momentum</strong>, despite lower scale.</p> </li> </ul> <div><hr /></div> <p><strong>Conclusion</strong></p> <ul data-spread="false"> <li> <p><strong>NSE</strong> remains the larger and more profitable exchange with strong fundamentals and consistent dividend payouts.</p> </li> <li> <p><strong>BSE</strong> is emerging as a <strong>high-growth alternative</strong> with expanding revenue streams and successful product innovations in derivatives and mutual funds.</p> </li> <li> <p>Valuation rerating in BSE (higher P/E) reflects market optimism about future growth, but NSE still provides stronger yield and stability.</p> </li> </ul> <div><hr /></div> <p> </p>
<p>Mitsubishi UFJ Financial Group (MUFG), Japan’s largest banking institution, is reportedly in advanced negotiations with HDFC Bank to acquire a minority stake in HDB Financial Services, its non-banking financial subsidiary. Sources familiar with the development revealed that the proposed transaction is pegged at around ₹12,000 crore, with MUFG aiming to secure a 17-19% stake. The deal is expected to be finalized within the next month, pending successful closure of ongoing talks.</p> <p><strong>1. Previous Talks and Valuation Recalibration</strong><br />This isn’t the first time both parties have engaged in discussions. An earlier round of negotiations had collapsed due to valuation disagreements. However, renewed discussions have gained traction, especially after HDB Financial Services’ valuation was revised down to the $8–8.5 billion range from an earlier estimate of $10–12 billion.</p> <p><strong>2. Regulatory Pressure Shapes Deal Dynamics</strong><br />The shift in valuation and urgency in closing the deal stems in part from regulatory headwinds. The Reserve Bank of India’s draft guidelines on ownership structures and overlapping business operations between banks and their group NBFCs have added pressure to rationalize group holdings. These new regulations prohibit similar lending activities by group entities within a banking conglomerate. Given these constraints, HDFC Bank may need to eventually reduce its current 94.54% holding in HDB Financial Services.</p> <p><strong>3. Deal May Offset Pre-IPO Expectations</strong><br />A successful transaction with MUFG could help HDFC Bank comply with RBI’s anticipated shareholding norms without necessitating a complex merger of HDB into the bank—a move that would involve significant challenges such as asset-liability mismatches and compliance with reserve requirements. With MUFG’s stake addition, HDB may also reassess its earlier plans for a pre-IPO placement, potentially scaling it down or scrapping it altogether.</p> <p><strong>4. Performance Pressures and Market Impact</strong><br />HDB Financial Services has faced recent headwinds in performance. In the March quarter, the NBFC’s net profit dropped to ₹530.9 crore from ₹656 crore in the same quarter the previous year. Its gross Stage 3 (non-performing) assets rose to 2.26%, up from 1.90% a year earlier, while return on assets declined from 3% to 1.8%. These operational pressures, along with RBI’s evolving policy environment, may have accelerated the urgency behind strategic partnerships like this one.</p> <p><strong>5. Broader Sector Recovery and Investor Sentiment</strong><br />While the unsecured loan sector has seen a recovery in market sentiment lately, the proposed MUFG investment could act as a confidence booster. It signals long-term institutional interest in India's NBFC segment despite regulatory and performance challenges.</p> <p><strong>6. No Official Comments Yet</strong><br />Both MUFG and HDFC Bank have refrained from making public comments on the matter. However, the closing of this deal could mark a major shift in ownership dynamics within HDB and may shape the strategic roadmap for HDFC Bank’s NBFC business going forward.</p>
<p class="" data-start="96" data-end="112"><strong data-start="96" data-end="112">Introduction</strong></p> <p class="" data-start="114" data-end="475">India’s hospitality unicorn OYO, led by founder Ritesh Agarwal, has been a focal point of investor interest and market speculation for years. After multiple attempts at going public, OYO’s IPO dreams have once again hit a pause—this time not because of regulatory hurdles or market conditions, but due to internal disagreement with its largest backer, SoftBank.</p> <p class="" data-start="477" data-end="506"><strong data-start="477" data-end="506">SoftBank Pulls the Brakes</strong></p> <p class="" data-start="508" data-end="859">According to recent media reports, SoftBank, which holds a 40% stake in OYO, has asked the company to defer its proposed IPO until its financial performance stabilizes. The Japanese conglomerate is reportedly concerned about OYO’s current earnings profile and believes a stronger financial showing will lead to better valuation and investor sentiment.</p> <p class="" data-start="861" data-end="1126">This is a significant development given SoftBank’s influential position in OYO’s boardroom. Founder Ritesh Agarwal owns around 30%, making this a classic case of diverging interests between a founder eager to go public and a key investor seeking financial prudence.</p> <p class="" data-start="1128" data-end="1169"><strong data-start="1128" data-end="1169">The IPO Timeline: A History of Delays</strong></p> <p class="" data-start="1171" data-end="1467">OYO initially planned to go public in 2021 with a targeted valuation of $12 billion. However, the IPO was shelved due to the pandemic-induced market uncertainty. The company made another attempt in March 2023 by filing confidential papers with SEBI, but the listing was again delayed in May 2023.</p> <p class="" data-start="1469" data-end="1669">In March 2024, OYO revived its IPO ambitions amidst pressure to meet upcoming debt obligations. However, the current standoff with SoftBank has cast doubt on whether an IPO will materialize this year.</p> <p class="" data-start="1671" data-end="1709"><strong data-start="1671" data-end="1709">Debt Overhang and Strategic Stakes</strong></p> <p class="" data-start="1711" data-end="2142">The pressure to list is not only strategic—it’s financial. Back in 2019, Ritesh Agarwal borrowed $2.2 billion from lenders including Mizuho Financial Group, backed by a personal guarantee from SoftBank’s Masayoshi Son. The purpose of the loan was to increase his stake in OYO and gain strategic control. That loan was later restructured in 2022, and repayment of the first tranche—amounting to $383 million—is due in December 2025.</p> <p class="" data-start="2144" data-end="2479">According to Bloomberg, creditors have warned that if OYO fails to list by October 2025, Agarwal may be compelled to repay the amount much sooner. However, if the IPO goes through this year, the repayment deadline could be pushed to 2027. This creates a financial incentive for Agarwal to push for an IPO despite SoftBank’s resistance.</p> <p class="" data-start="2481" data-end="2516"><strong data-start="2481" data-end="2516">SoftBank’s Possible Middle Path</strong></p> <p class="" data-start="2518" data-end="2836">SoftBank’s opposition doesn’t appear to be absolute. Reports suggest that it may be willing to support Agarwal in negotiating an extension of the loan in return for postponing the IPO. This could allow OYO more time to strengthen its earnings, restore investor confidence, and aim for a higher valuation in the future.</p> <p class="" data-start="2838" data-end="2864"><strong data-start="2838" data-end="2864">Strategic Implications</strong></p> <p class="" data-start="2866" data-end="2911">The delayed IPO has significant implications:</p> <ul data-start="2913" data-end="3362"> <li class="" data-start="2913" data-end="3055"> <p class="" data-start="2915" data-end="3055"><strong data-start="2915" data-end="2930">For Agarwal</strong>: The delay means continued uncertainty on his loan obligations and limited flexibility in unlocking capital from OYO shares.</p> </li> <li class="" data-start="3059" data-end="3224"> <p class="" data-start="3061" data-end="3224"><strong data-start="3061" data-end="3077">For SoftBank</strong>: By postponing the IPO, SoftBank may preserve value and avoid a potentially discounted listing, especially if OYO’s financials are not yet strong.</p> </li> <li class="" data-start="3228" data-end="3362"> <p class="" data-start="3230" data-end="3362"><strong data-start="3230" data-end="3245">For Markets</strong>: Investors awaiting the OYO IPO as one of the key startup listings of FY25 may now have to reset their expectations.</p> </li> </ul> <p class="" data-start="3364" data-end="3378"><strong data-start="3364" data-end="3378">Conclusion</strong></p> <p class="" data-start="3380" data-end="3811">OYO’s story is emblematic of the evolving dynamics between founders and their marquee investors in India’s startup ecosystem. While the ambition to list publicly remains intact, current financial realities and investor priorities have forced a recalibration. Whether the company goes public later this year—or waits to build a stronger earnings base—will likely depend on how these negotiations between Agarwal and SoftBank unfold.</p> <p class="" data-start="3813" data-end="4019"> </p>

<p data-pm-slice="1 1 []"><strong>1. Overview</strong></p> <p><strong>Source</strong>: Official websites of CDSL and NSDL</p> <p>India has two major securities depositories: <strong>Central Depository Services (India) Ltd. (CDSL)</strong> and <strong>National Securities Depository Ltd. (NSDL)</strong>. Both play a pivotal role in the Indian capital markets, enabling electronic storage and transfer of securities. While they serve similar purposes, their business models and target segments differ significantly.</p> <div><hr /></div> <p><strong>2. Business Model Comparison</strong></p> <h4>a) <strong>CDSL: Retail-Driven Model</strong></h4> <p>CDSL’s business primarily caters to <strong>retail investors</strong>, thriving on the exponential growth of individual demat accounts.</p> <p><strong>Key business activities:</strong></p> <ul data-spread="false"> <li> <p><strong>Account Maintenance</strong>: Charges annual maintenance fees and transaction fees through Depository Participants (DPs) serving retail clients.</p> </li> <li> <p><strong>High Transaction Volumes</strong>: Retail clients trade frequently in smaller lot sizes, resulting in steady transaction-based revenue.</p> </li> <li> <p><strong>Digital & Ancillary Services</strong>: Through its subsidiary CVL, CDSL provides services like:</p> <ul data-spread="false"> <li> <p>e-KYC and e-signature verification</p> </li> <li> <p>e-voting platforms</p> </li> <li> <p>Central KYC Registry operations</p> </li> </ul> </li> <li> <p><strong>Dematerialization of Unlisted Shares</strong>: Rising demand from startups and ESOP stakeholders creates additional revenue avenues.</p> </li> </ul> <p><strong>Scalability:</strong> CDSL’s model thrives on <strong>volume growth</strong>, <strong>low operating cost</strong>, and <strong>digital integration</strong>, making it highly scalable and profitable with expanding margins.</p> <h4>b) <strong>NSDL: Institution-Driven Model</strong></h4> <p>NSDL was India’s first depository and continues to dominate in the <strong>institutional and custody segment</strong>.</p> <p><strong>Key business activities:</strong></p> <ul data-spread="false"> <li> <p><strong>Custody & Settlement</strong>: Major clients include mutual funds, FIIs, insurance companies, and pension funds.</p> </li> <li> <p><strong>Debt Market Instruments</strong>: Preferred platform for handling corporate bonds, G-Secs, CPs, and CDs.</p> </li> <li> <p><strong>Issuer Services</strong>: Facilitates IPO processes, dividend distributions, bonus issues, and buybacks.</p> </li> <li> <p><strong>Government Projects via NSDL e-Gov</strong>:</p> <ul data-spread="false"> <li> <p>PAN issuance and management</p> </li> <li> <p>National Pension Scheme (NPS) recordkeeping</p> </li> <li> <p>Central KYC Registry</p> </li> </ul> </li> </ul> <p><strong>Revenue Characteristics:</strong></p> <ul data-spread="false"> <li> <p><strong>Sticky and long-term contracts</strong></p> </li> <li> <p><strong>Less cyclical in nature</strong></p> </li> <li> <p><strong>Slower growth due to limited scalability and reliance on a few high-value clients</strong></p> </li> </ul> <div><hr /></div> <p><strong>3. Financial Performance (₹ in Crore)</strong></p> <p><strong>Source</strong>: Screener.in and UnlistedZone</p> <table style="width: 60.6734%;"> <tbody> <tr> <th style="width: 26.617%; text-align: center;">Particulars</th> <th style="width: 35.9683%; text-align: center;">CDSL (FY25E)</th> <th style="width: 37.3277%; text-align: center;">NSDL (FY25E est.)</th> </tr> <tr> <td style="width: 26.617%; text-align: center;">Revenue</td> <td style="width: 35.9683%; text-align: center;">₹872 Cr</td> <td style="width: 37.3277%; text-align: center;">₹1,056 Cr</td> </tr> <tr> <td style="width: 26.617%; text-align: center;">PAT</td> <td style="width: 35.9683%; text-align: center;">₹550 Cr</td> <td style="width: 37.3277%; text-align: center;">₹340 Cr (estimated)</td> </tr> <tr> <td style="width: 26.617%; text-align: center;">Net Profit Margin</td> <td style="width: 35.9683%; text-align: center;">~63%</td> <td style="width: 37.3277%; text-align: center;">~32%</td> </tr> </tbody> </table> <div><hr /></div> <p><strong>4. Valuation Snapshot (as on 30-Apr-2025)</strong></p> <table style="width: 57.7842%;"> <tbody> <tr> <td style="width: 46.6951%; text-align: center;"><strong>Parameter</strong></td> <td style="width: 28.7355%; text-align: center;"><strong>CDSL</strong></td> <td style="width: 24.47%; text-align: center;"><strong>NSDL (Unlisted)</strong></td> </tr> <tr> <td style="width: 46.6951%; text-align: center;">Market Capitalization</td> <td style="width: 28.7355%; text-align: center;">₹27,000 Cr</td> <td style="width: 24.47%; text-align: center;">₹15,000 – ₹18,000 Cr</td> </tr> <tr> <td style="width: 46.6951%; text-align: center;">FY25E PAT</td> <td style="width: 28.7355%; text-align: center;">₹550 Cr</td> <td style="width: 24.47%; text-align: center;">₹340 Cr (est.)</td> </tr> <tr> <td style="width: 46.6951%; text-align: center;">P/E Ratio (FY25E)</td> <td style="width: 28.7355%; text-align: center;">~50x</td> <td style="width: 24.47%; text-align: center;">Implied ~44x – 53x</td> </tr> <tr> <td style="width: 46.6951%; text-align: center;">Shares Outstanding</td> <td style="width: 28.7355%; text-align: center;">~20.9 Cr</td> <td style="width: 24.47%; text-align: center;">~20 Cr</td> </tr> </tbody> </table> <div><hr /></div> <p><strong>5. Conclusion</strong></p> <table style="width: 81.259%;"> <tbody> <tr> <td style="width: 58.0848%; text-align: center;"><strong>CDSL</strong></td> <td style="width: 42.0022%; text-align: center;"><strong>NSDL</strong></td> </tr> <tr> <td style="width: 58.0848%; text-align: center;">High growth potential from retail boom</td> <td style="width: 42.0022%; text-align: center;">Stable institutional income and government ties</td> </tr> <tr> <td style="width: 58.0848%; text-align: center;">Profitable due to volume + tech advantage</td> <td style="width: 42.0022%; text-align: center;">Lower volatility with stickier contracts</td> </tr> <tr> <td style="width: 58.0848%; text-align: center;">Best suited for growth-focused investors</td> <td style="width: 42.0022%; text-align: center;">Ideal for conservative or long-term investors</td> </tr> </tbody> </table> <p><strong>Final Verdict:</strong> Both depositories offer distinct value propositions.</p> <ul data-spread="false"> <li> <p>Choose <strong>CDSL</strong> if you seek <strong>high growth and returns</strong> driven by retail and fintech momentum.</p> </li> <li> <p>Choose <strong>NSDL</strong> if you prefer <strong>stability, long-term contracts</strong>, and exposure to India’s institutional financial infrastructure.</p> </li> </ul> <p><strong>Investment decision should align with your risk appetite and holding period.</strong></p> <p> </p>
<p>Hero FinCorp, the financial services arm of the Hero Group, has declared its financial results for the fiscal year 2025. Known for its diverse loan portfolio and strong retail presence, the company has shown significant growth in income but also raised concerns due to a sharp rise in provisioning and stressed assets.</p> <p><strong>Hero FinCorp’s Core Business Model</strong><br />Hero FinCorp Limited (HFCL) is a leading non-banking financial company (NBFC) in India, originally incorporated in 1991 under the name Hero Honda FinLease Limited. Following changes in the ownership structure of its parent company, Hero MotoCorp (formerly Hero Honda Motors), it was renamed Hero FinCorp Limited. The company has grown to become a major financial services provider with a strong footprint in both retail and corporate lending segments.</p> <p>Hero FinCorp is involved in the business of financing, leasing, bill discounting, and other financial solutions. A significant part of its operations is backed by its wholly-owned subsidiary, Hero Housing Finance Limited (HHFL), which offers housing loans across the country. HHFL commenced operations in April 2018 and has shown rapid growth since then. Within the first year of its launch, it disbursed loans worth over ₹556 crore. To support this growth, Hero FinCorp invested ₹200 crore into HHFL via a rights issue.</p> <p><strong>Loan Portfolio</strong><br />Hero FinCorp lends in multiple categories. A major chunk of its business comes from financing Hero two-wheelers, especially in tier-2 and tier-3 cities. In addition to this, the company provides used car loans, personal loans, loans against property (LAP), and business loans to SMEs. On the corporate side, it also provides structured finance and working capital loans. This diversification helps them manage risk and tap into various market segments.</p> <p><strong>Financial Performance FY25 Compared to FY24 </strong><br />Hero FinCorp posted a solid 15% growth in interest earned, rising from ₹7,479 crore in FY24 to ₹8,589 crore in FY25. Other income also jumped sharply from ₹880 crore to ₹1,314 crore, showing a growth of almost 49%. However, this growth came at a cost.</p> <p>The company’s interest expenditure increased significantly from ₹3,097 crore to ₹3,827 crore, indicating rising borrowing costs. Operating expenses too rose from ₹2,513 crore to ₹2,935 crore. But the most worrying trend was in provisions and contingencies, which surged from ₹1,722 crore in FY24 to ₹2,884 crore in FY25 — a rise of more than 67%.</p> <p>Due to these factors, net profit (PAT) dropped sharply from ₹637 crore to just ₹110 crore. Earnings per share (EPS) also saw a steep fall, going from ₹50.16 in FY24 to ₹8.63 in FY25 — an alarming 82% decline in profitability.</p> <p><strong>Asset Quality Under Pressure: NPAs and Provisions on the Rise</strong><br />The rise in provisioning is linked to the worsening asset quality. Gross NPA increased from 4.02% to 5.05%, and Net NPA went up from 2% to 2.3% in FY25. This clearly indicates growing stress in the loan book — possibly due to economic slowdown in some sectors, repayment delays in retail or SME loans, or higher default rates in unsecured segments like personal loans.</p> <p>To stay cautious, Hero FinCorp has aggressively increased its provisioning to safeguard its balance sheet. While this move is prudent from a risk management point of view, it has heavily impacted their profit for the year.</p> <p><br /><strong>What Is the Current Valuation of Hero FinCorp? </strong><br />Despite the fall in profitability, the company commands a strong valuation. As of FY25, Hero FinCorp’s market capitalization stands at ₹16,880.5 crore. The Price-to-Earnings (P/E) ratio is extremely high at 153.53, which indicates that the stock is priced for strong future recovery, not current earnings. The Price-to-Book (P/B) ratio is 2.93, suggesting that investors are willing to pay almost 3 times its book value — a premium valuation.</p> <p>On the return side, Return on Equity (ROE) has dropped significantly to 1.91%, showing weaker efficiency in generating returns for shareholders. The company has a debt-to-equity ratio of 8.33, highlighting its reliance on debt funding — common in NBFCs but worth keeping an eye on.</p> <p><strong>Conclusion</strong><br />Hero FinCorp’s FY25 results paint a mixed picture. While the top-line performance is strong and income is growing steadily, the rising provisions and higher NPAs are causes for concern. Profitability has taken a hit, and ROE has dropped substantially. However, the market continues to value the company at a premium, likely betting on long-term growth potential and improved profitability once asset quality stabilizes.</p>
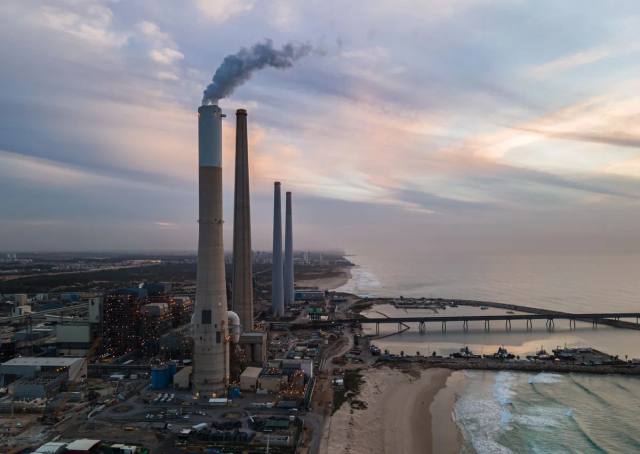
<p>Vikram Solar Ltd, a leading solar energy solutions provider, has introduced its latest product line—the HYPERSOL series, featuring n-type bifacial solar modules. The new modules are designed to deliver a power range between 605 Wp and 630 Wp, showcasing the company’s technological advancement in solar module engineering.</p> <p><strong>1. Technical Superiority and High Efficiency</strong><br />The HYPERSOL G12R modules are constructed using 132 half-cut bifacial cells, based on the G12R rectangular wafer format (182mm x 210mm). This design enables efficiency levels between 22.38% and 23.30%, and a high bifaciality of up to 80%, allowing improved energy capture from both sides of the panel. With a temperature coefficient of -0.30%/°C, the modules promise stable performance even in high-heat environments.</p> <p><strong>2. Durable, Compliant, and Eco-Friendly Design</strong><br />Each module is manufactured to meet global quality and safety certifications, including IEC, UL, and BIS standards. Designed with recyclable materials, the HYPERSOL modules align with global sustainability efforts while ensuring long-term reliability. Dimensionally, the panels measure 2,384 mm x 1,134 mm x 30 mm and weigh approximately 32.1 kg, with a ±5% tolerance.</p> <p><strong>3. Industry Insight and Strategic Focus</strong><br />Commenting on the product launch, Gyanesh Chaudhary, Chairman and Managing Director of Vikram Solar, emphasized the company's commitment to innovation. He noted, “As the industry transitions to rectangular n-type solar cells, our HYPERSOL G12R series is a strategic response to meet the market's need for higher energy output and cost-optimized solutions. This launch reflects our dedication to pushing the boundaries of efficiency and promoting sustainable solar technologies.”</p> <p><strong>4. Reinforcing Commitment to Performance and Sustainability</strong><br />Vikram Solar’s HYPERSOL series strengthens the company’s portfolio by offering next-generation solar modules that combine high efficiency with environmental consciousness. The product is aimed at utility-scale, commercial, and industrial projects looking for long-term performance stability, lower operational costs, and greater energy gains.</p>
<p>Hero FinCorp (HFCL), the financial services arm of Hero MotoCorp, is actively pursuing a $200 million syndicated loan to support its lending operations. According to individuals aware of the development, the company has appointed DBS Bank as the lead arranger for the facility. This move reflects the firm’s strategy to secure alternate funding amid regulatory roadblocks surrounding its upcoming public offering.</p> <p><strong>Investor Roadshows Begin in Taiwan</strong><br />To kickstart the fundraising effort, DBS Bank has launched investor roadshows in Taipei, signaling Hero FinCorp’s intent to tap into the Asia-Pacific capital market. These meetings are being held to assess investor sentiment and explore participation from institutional lenders in the region.</p> <p><strong>IPO Plans Facing Regulatory Hurdles</strong><br />Hero FinCorp's ₹3,668 crore Initial Public Offering (IPO), initially seen as a major capital-raising initiative, has been delayed due to pending regulatory approvals. Sources indicate that the Securities and Exchange Board of India (SEBI) is currently examining potential compliance issues that may have arisen during the IPO preparation process, thereby pausing the timeline for launch.</p> <p><strong>Purpose of the Loan</strong><br />The proceeds from the dollar-denominated loan are expected to be deployed to support Hero FinCorp’s core lending business, helping the non-banking financial company (NBFC) maintain momentum in its credit operations while alternative funding plans remain in flux.</p> <p><strong>Loan Structure and Market Trends</strong><br />The structure under consideration includes two loan tenors — five years and 3.25 years — catering to varying investor risk appetites. Although final pricing for the facility has not yet been announced, similar transactions provide a benchmark. For instance, Piramal Finance successfully raised $150 million in October 2024 through international bonds, achieving a 7.078% yield over a 3.32-year maturity.</p> <p>This financing approach follows a broader trend among Indian NBFCs such as Shriram Finance, Muthoot Finance, and Tata Capital, which have increasingly turned to global bond and loan markets to lower borrowing costs and diversify their funding profiles.</p> <p><strong>Official Response and Market Outlook</strong><br />Neither Hero FinCorp nor DBS Bank has issued a public statement regarding the development. However, the market views this fundraising move as a calculated step to mitigate the effects of the IPO delay and maintain liquidity buffers.</p> <p>Given the active participation of NBFCs in overseas debt markets and the increasing investor interest in Indian credit, Hero FinCorp’s syndicated loan may attract significant institutional interest, particularly as yield-hungry investors look for quality paper in emerging markets.</p> <p><strong>Conclusion</strong><br />With its IPO timeline uncertain, Hero FinCorp’s decision to pursue a $200 million syndicated loan under DBS Bank’s leadership represents a proactive approach to capital management. As global investors show increased interest in Indian financial firms, this strategy could not only secure immediate liquidity but also establish long-term confidence in Hero FinCorp’s financial prudence.</p>


<p>The Delhi High Court, on Monday, responded to a legal request from OYO Hotels & Homes by issuing a notice to various media outlets. The hospitality firm approached the court with concerns over news reports they claim are defamatory in nature and linked to a First Information Report (FIR) filed in Rajasthan against the company and its founder, Ritesh Agarwal.</p> <p>Justice Amit Bansal, presiding over the matter, directed the news platforms to respond to the petition. Additionally, the court allowed OYO to submit its side of the story to the same media portals along with a copy of the Rajasthan High Court order, which currently puts a stay on any action stemming from the FIR.</p> <p><strong>Background: Dispute with Rajasthan Hotel Owners</strong></p> <p>OYO finds itself in a heated legal battle involving multiple accusations from hotel owners and state regulators. The allegations revolve around suspected breaches of state regulations related to hotel management, consumer protection laws, and taxation rules. </p> <p>In particular, hotel operators from Rajasthan cities such as Jaipur, Udaipur, and Jodhpur have accused OYO of employing questionable business tactics. These include offering extreme discounts, delaying payments to hotel partners, modifying contractual agreements without consent, and withholding Goods and Services Tax (GST) collected from customers.</p> <p><strong>FIR Details: Fraud and Tax Allegations</strong></p> <p>The situation escalated when Samskara Resort, a hotel based in Jaipur, filed an FIR against OYO and its founder. The complaint accused the company of inflating revenue through fake bookings totaling ₹22.5 crore. This allegedly led to a GST demand being issued to the resort, with claims that similar tactics had been used across other hospitality businesses in the state.</p> <p>According to the FIR, these alleged actions resulted in multiple tax-related notices from state authorities. The Rajasthan High Court, however, has since stepped in and temporarily halted any punitive measures arising from the FIR.</p> <p><strong>OYO Seeks Control Over Media Narrative</strong></p> <p>In the Delhi High Court, OYO asserted that several news articles were published based on the FIR without the company being contacted for its viewpoint. Senior Advocate Satvik Varma, representing OYO, argued that these reports unfairly damaged the company’s reputation and brand image by presenting a one-sided narrative.</p> <p>OYO further claimed that its founder’s image and company trademarks were used in these articles without permission, further compounding the alleged reputational harm.</p> <p><strong>Relief Granted: Right to Publish Rebuttal</strong></p> <p>Although the Delhi High Court declined to impose an immediate ban on such media publications, it granted OYO permission to share its response with the concerned outlets. The Court directed that once OYO submits its version and the Rajasthan High Court order, media platforms should give it due coverage.</p> <p>The Court’s decision provides OYO an opportunity to counter what it describes as false and misleading narratives in the public domain.</p> <p><strong>Legal Representation </strong></p> <p>Representing OYO’s parent company, Oravel Stays Limited, Senior Advocate Satvik Varma appeared before the Court, supported by legal counsels Manish Dhir, Shantanu Parmar, and Balram. Their plea aimed at protecting both the company’s public image and its legal interests amidst ongoing investigations and media scrutiny.</p>

<p class="" data-start="402" data-end="418"><strong data-start="402" data-end="418">Introduction</strong></p> <p class="" data-start="420" data-end="839">SBI General Insurance Company Ltd., one of India's leading private general insurers, has announced its standalone audited financial results for the year ending March 31, 2025. The performance demonstrates strong operational resilience, significant profit growth, and a healthy balance sheet – making <em data-start="720" data-end="758">SBI General Insurance Unlisted Share</em> an increasingly attractive opportunity for pre-IPO and unlisted share investors.</p> <p class="" data-start="841" data-end="985">In this detailed analysis, we cover SBI General’s FY25 performance, key financial highlights, associated risks, and our expert outlook for FY26.</p> <hr class="" data-start="987" data-end="990" /> <h2 class="" data-start="992" data-end="1019">1. Strong Revenue Growth</h2> <p class="" data-start="1021" data-end="1191">The company continues to post impressive top-line growth, driven by an expanding customer base and robust product demand across retail and commercial insurance verticals.</p> <ul data-start="1193" data-end="1306"> <li class="" data-start="1193" data-end="1306"> <p class="" data-start="1195" data-end="1221"><strong data-start="1195" data-end="1221">Income from Operations</strong></p> <ul data-start="1224" data-end="1306"> <li class="" data-start="1224" data-end="1242"> <p class="" data-start="1226" data-end="1242">FY25: ₹14,104 Cr</p> </li> <li class="" data-start="1245" data-end="1263"> <p class="" data-start="1247" data-end="1263">FY24: ₹12,730 Cr</p> </li> <li class="" data-start="1266" data-end="1306"> <p class="" data-start="1268" data-end="1306"><strong data-start="1268" data-end="1282">YoY Growth</strong>: ₹1,374 Cr (<strong data-start="1295" data-end="1305">+10.8%</strong>)</p> </li> </ul> </li> </ul> <p class="" data-start="1308" data-end="1421">The steady rise in income reflects growth in <em data-start="1353" data-end="1382">Gross Written Premium (GWP)</em> and an enhanced geographical presence.</p> <hr class="" data-start="1423" data-end="1426" /> <h2 class="" data-start="1428" data-end="1465">2. Exceptional Profitability Surge</h2> <p class="" data-start="1467" data-end="1593">FY25 marked a significant jump in SBI General’s profitability metrics, with the company recording over 100% growth in profits.</p> <ul data-start="1595" data-end="1812"> <li class="" data-start="1595" data-end="1705"> <p class="" data-start="1597" data-end="1624"><strong data-start="1597" data-end="1624">Profit Before Tax (PBT)</strong></p> <ul data-start="1627" data-end="1705"> <li class="" data-start="1627" data-end="1648"> <p class="" data-start="1629" data-end="1648">FY25: ₹67,592 Lakhs</p> </li> <li class="" data-start="1651" data-end="1672"> <p class="" data-start="1653" data-end="1672">FY24: ₹31,884 Lakhs</p> </li> <li class="" data-start="1675" data-end="1702"> <p class="" data-start="1677" data-end="1702"><strong data-start="1677" data-end="1691">YoY Growth</strong>: <strong data-start="1693" data-end="1702">+112%</strong></p> </li> </ul> </li> <li class="" data-start="1706" data-end="1812"> <p class="" data-start="1708" data-end="1734"><strong data-start="1708" data-end="1734">Profit After Tax (PAT)</strong></p> <ul data-start="1737" data-end="1812"> <li class="" data-start="1737" data-end="1758"> <p class="" data-start="1739" data-end="1758">FY25: ₹50,876 Lakhs</p> </li> <li class="" data-start="1761" data-end="1782"> <p class="" data-start="1763" data-end="1782">FY24: ₹23,984 Lakhs</p> </li> <li class="" data-start="1785" data-end="1812"> <p class="" data-start="1787" data-end="1812"><strong data-start="1787" data-end="1801">YoY Growth</strong>: <strong data-start="1803" data-end="1812">+112%</strong></p> </li> </ul> </li> </ul> <p class="" data-start="1814" data-end="1830"><strong data-start="1814" data-end="1829">Key Drivers</strong>:</p> <ul data-start="1831" data-end="1921"> <li class="" data-start="1831" data-end="1862"> <p class="" data-start="1833" data-end="1862">Improved underwriting margins</p> </li> <li class="" data-start="1863" data-end="1889"> <p class="" data-start="1865" data-end="1889">Higher investment income</p> </li> <li class="" data-start="1890" data-end="1921"> <p class="" data-start="1892" data-end="1921">Cost optimization initiatives</p> </li> </ul> <hr class="" data-start="1923" data-end="1926" /> <h2 class="" data-start="1928" data-end="1964">3. Healthy Balance Sheet Strength</h2> <p class="" data-start="1966" data-end="2078">SBI General Insurance maintains a robust capital structure, providing confidence for sustained future expansion.</p> <ul data-start="2080" data-end="2298"> <li class="" data-start="2080" data-end="2178"> <p class="" data-start="2082" data-end="2095"><strong data-start="2082" data-end="2095">Net Worth</strong></p> <ul data-start="2098" data-end="2178"> <li class="" data-start="2098" data-end="2121"> <p class="" data-start="2100" data-end="2121">FY25: ₹4,67,403 Lakhs</p> </li> <li class="" data-start="2124" data-end="2147"> <p class="" data-start="2126" data-end="2147">FY24: ₹4,14,449 Lakhs</p> </li> <li class="" data-start="2150" data-end="2178"> <p class="" data-start="2152" data-end="2178"><strong data-start="2152" data-end="2166">YoY Growth</strong>: <strong data-start="2168" data-end="2178">+12.8%</strong></p> </li> </ul> </li> <li class="" data-start="2180" data-end="2228"> <p class="" data-start="2182" data-end="2228"><strong data-start="2182" data-end="2206">Equity Share Capital</strong>: ₹22,376 Lakhs (FY25)</p> </li> <li class="" data-start="2229" data-end="2298"> <p class="" data-start="2231" data-end="2298"><strong data-start="2231" data-end="2252">Debt-Equity Ratio</strong>: Improved to 0.15 in FY25 (from 0.17 in FY24)</p> </li> </ul> <p class="" data-start="2300" data-end="2320"><strong data-start="2300" data-end="2319">Coverage Ratios</strong>:</p> <ul data-start="2321" data-end="2451"> <li class="" data-start="2321" data-end="2398"> <p class="" data-start="2323" data-end="2398"><strong data-start="2323" data-end="2358">Interest Service Coverage Ratio</strong>: 12.59 (significantly better from 0.91)</p> </li> <li class="" data-start="2399" data-end="2451"> <p class="" data-start="2401" data-end="2451"><strong data-start="2401" data-end="2432">Debt Service Coverage Ratio</strong>: 12.59 (vs. 50.91)</p> </li> </ul> <p class="" data-start="2453" data-end="2565">This solid financial base strengthens SBI General's capacity to underwrite higher risks and expand market share.</p> <hr class="" data-start="2567" data-end="2570" /> <h2 class="" data-start="2572" data-end="2612">4. Earnings Per Share (EPS) Expansion</h2> <ul data-start="2614" data-end="2713"> <li class="" data-start="2614" data-end="2662"> <p class="" data-start="2616" data-end="2662"><strong data-start="2616" data-end="2629">Basic EPS</strong>: ₹22.75 (up from ₹10.83 in FY24)</p> </li> <li class="" data-start="2663" data-end="2713"> <p class="" data-start="2665" data-end="2713"><strong data-start="2665" data-end="2680">Diluted EPS</strong>: ₹22.73 (up from ₹10.82 in FY24)</p> </li> </ul> <p class="" data-start="2715" data-end="2931">The <strong data-start="2719" data-end="2739">more than double</strong> EPS growth underscores the company's enhanced profitability and value accretion for shareholders, further improving the attractiveness of SBI General Insurance in the <em data-start="2907" data-end="2924">unlisted shares</em> space.</p> <hr class="" data-start="2933" data-end="2936" /> <h2 class="" data-start="2938" data-end="2960">5. Risks to Monitor</h2> <p class="" data-start="2962" data-end="3052">Despite the strong performance, certain sector-specific risks should be watched carefully:</p> <ul data-start="3054" data-end="3352"> <li class="" data-start="3054" data-end="3150"> <p class="" data-start="3056" data-end="3150"><strong data-start="3056" data-end="3077">Claims Volatility</strong>: Natural calamities or pandemics can increase claim ratios unexpectedly.</p> </li> <li class="" data-start="3151" data-end="3247"> <p class="" data-start="3153" data-end="3247"><strong data-start="3153" data-end="3175">Regulatory Changes</strong>: Revisions in insurance pricing policies by IRDAI could impact margins.</p> </li> <li class="" data-start="3248" data-end="3352"> <p class="" data-start="3250" data-end="3352"><strong data-start="3250" data-end="3276">Investment Market Risk</strong>: Insurance companies’ investment incomes are sensitive to market movements.</p> </li> </ul> <p class="" data-start="3354" data-end="3474">Being mindful of these risks is critical when evaluating long-term investment potential in unlisted insurance companies.</p> <hr class="" data-start="3476" data-end="3479" /> <h2 class="" data-start="3481" data-end="3504">6. UnlistedZone View</h2> <p class="" data-start="3506" data-end="3711">At <strong data-start="3509" data-end="3525">UnlistedZone</strong>, we believe <strong data-start="3538" data-end="3578">SBI General Insurance Unlisted Share</strong> offers a <strong data-start="3588" data-end="3614">compelling opportunity</strong> for investors looking for strong financials backed by a reputed parentage (State Bank of India).</p> <p class="" data-start="3713" data-end="3731"><strong data-start="3713" data-end="3730">Key Strengths</strong>:</p> <ul data-start="3732" data-end="3910"> <li class="" data-start="3732" data-end="3757"> <p class="" data-start="3734" data-end="3757">Parent support from SBI</p> </li> <li class="" data-start="3758" data-end="3802"> <p class="" data-start="3760" data-end="3802">Extensive branch and bancassurance network</p> </li> <li class="" data-start="3803" data-end="3849"> <p class="" data-start="3805" data-end="3849">Consistent profitability and solvency ratios</p> </li> <li class="" data-start="3850" data-end="3910"> <p class="" data-start="3852" data-end="3910">Ready for eventual IPO listing – strong rerating potential</p> </li> </ul> <p class="" data-start="3912" data-end="4040">Given the current momentum, SBI General is well-positioned to further consolidate its leadership in the Indian insurance market.</p> <hr class="" data-start="4042" data-end="4045" /> <h1 class="" data-start="4047" data-end="4059">Conclusion</h1> <p class="" data-start="4061" data-end="4338">The <strong data-start="4065" data-end="4085">FY25 performance</strong> of SBI General Insurance reflects a transformative year marked by revenue expansion, profit doubling, and improved operational efficiency. The company’s prudent risk management and balanced growth strategies create a strong platform for future success.</p> <p class="" data-start="4340" data-end="4445">As an <em data-start="4346" data-end="4379">unlisted investment opportunity</em>, SBI General Insurance stands out among private general insurers.</p> <p class="" data-start="4447" data-end="4681"><strong data-start="4447" data-end="4463">FY26 Outlook</strong>: We recommend closely tracking underwriting performance, investment yields, and solvency positions, which will indicate whether the company can sustain its exceptional performance in a competitive insurance landscape.</p> <p class="" data-start="4683" data-end="4798">For investors exploring <strong data-start="4707" data-end="4725">pre-IPO shares</strong>, SBI General Insurance remains a fundamentally strong and strategic bet.</p>
<p>Popular craft beer brand Bira 91 is currently under fire from former and current staff over unpaid salaries, outstanding reimbursements, and unresolved dues following months of layoffs. Several employees have come forward with allegations that they were either forced to resign or laid off with compensation still pending. One ex-sales executive shared that after resigning in December, he was asked to serve a two-month notice, only to have it shortened unexpectedly. Despite repeated assurances, his payments have remained pending for over three months, with the latest update pushing the due date to the end of May.</p> <p><strong>1. Internal Reassignments and Forced Resignations</strong><br />Tensions reportedly began in November 2024 when the company halted reimbursement for business travel and other expenses. Matters escalated in early 2025 as staff were abruptly reassigned to different states and job roles—marketing professionals were instructed to switch to sales, often in unfamiliar territories. According to a former employee, about 70% of the workforce faced similar shifts. Those unwilling to comply were allegedly pressured into quitting.</p> <p><strong>2. Massive Marketing Spend Amid Operational Disruptions</strong><br />Ex-employees have pointed to what they describe as poor financial planning, citing extravagant spending on branding and sponsorships. Bira 91 had allocated an estimated Rs 200–250 crore towards a five-year sponsorship deal with the ICC, which concluded in 2023, in addition to collaborations with several IPL franchises. However, while demand was being generated through high-cost ATL (Above The Line) and BTL (Below The Line) marketing campaigns, the supply side faltered. "There was no stock, vendors weren’t paid, raw materials stopped coming in, and breweries came to a standstill," said one employee.</p> <p><strong>3. Label Change Triggers Operational Setbacks</strong><br />In 2023, Bira 91 underwent a legal name change, which required product relabelling across multiple regions. This relabelling process led to a chain reaction—delays in supplier payments, a shortage of summer stock, and ultimately, disruption during the peak beer production season. Insiders claim that the widely publicized Rs 80 crore loss attributed to labelling issues was merely a smokescreen for deeper financial mismanagement.</p> <p><strong>4. Industry View: Rapid Expansion Gone Wrong</strong><br />Experts from the alcoholic beverage sector point to Bira’s overambitious growth strategy as a root cause of its troubles. Vinod Giri, Director General of the Brewers Association of India, commented that beer brands seeking rapid expansion often miscalculate their operational capacities. “Scaling with the wrong regional focus or underutilized infrastructure can backfire quickly,” he noted.</p> <p><strong>5. Investor Backing Didn’t Prevent Financial Slide</strong><br />Despite securing significant backing—approximately USD 457 million from investors like Sofina, Kirin Holdings, MUFG Bank, and Peak XV Partners—Bira 91 has struggled to maintain financial stability. Its most recent funding round of USD 25 million closed in 2024. However, the company’s revenue dropped by 22% to Rs 638 crore in FY24, while net losses ballooned to Rs 748 crore, largely due to inventory write-offs associated with the relabelling initiative.</p> <p><strong>6. Scaling Missteps and Misunderstood Economics</strong><br />Industry analysts argue that Bira 91’s pivot from a niche identity to a scale-focused model came at the cost of operational balance. Sanjay Jain, an expert in the alco-bev space, remarked, “Beer relies heavily on volumes. While Bira carved out a unique market early on, the sudden push for expansion missed the mark. Venture capital tends to approach it like an FMCG play, but the economics of beer production are fundamentally different.”</p> <p><strong>Conclusion: A Brand at Crossroads</strong><br />Bira 91 now finds itself at a critical juncture—grappling with dissatisfied employees, financial strain, and supply chain hiccups. What was once a poster child of India's new-age beer movement must now reassess its strategy and restore trust among both its internal teams and external stakeholders.</p>
Indicative prices, company research and your enquiries — in your pocket. Get price notes on the names you follow and reach our team from anywhere.


