Analysis, guides and explainers on India's unlisted market — from IPO pipelines to ESOP liquidity.

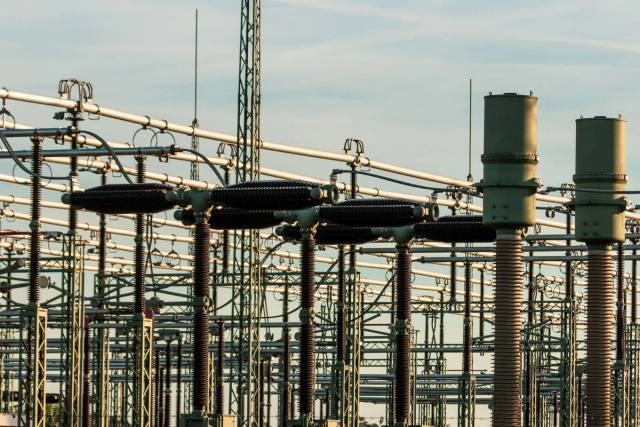
<h2 data-pm-slice="1 1 []"><strong>Introduction</strong></h2> <p>The <strong>National Stock Exchange of India (NSE)</strong> has received a green light from <strong>SEBI</strong> to launch <strong>monthly electricity futures contracts</strong> — a bold step that could transform India’s power market landscape. As India pushes toward <strong>net-zero emissions</strong> and a <strong>cleaner energy future</strong>, the move is set to <strong>deepen the country's power markets</strong>, <strong>improve transparency</strong>, and <strong>attract climate-aligned investments</strong>.</p> <p>This development is not only timely but also strategically important for <strong>NSE</strong> as it expands its influence in the <strong>commodity derivatives space</strong>, especially in <strong>energy trading</strong> — traditionally dominated by platforms like <strong>IEX</strong>.</p> <p>In this blog, we break down what this move means, its relevance to India's renewable goals, and how it might affect investors in power and energy sectors.</p> <div><hr /></div> <h2><strong>A) What Are Monthly Electricity Futures?</strong></h2> <p><strong>Electricity futures</strong> are standardized contracts that allow participants to <strong>buy or sell electricity at a fixed price for a future date</strong>. These contracts help manage the risk of <strong>price fluctuations</strong>, ensure better <strong>demand planning</strong>, and improve <strong>efficiency</strong> in the energy value chain.</p> <p>Unlike the current <strong>spot-based model</strong> where trades happen in real time (as on <strong>IEX</strong>), <strong>futures contracts provide hedging tools</strong> for <strong>large industrial consumers</strong>, <strong>generators</strong>, and <strong>distribution companies</strong> to lock in prices.</p> <p>With <strong>monthly futures</strong>, power sector players can now plan with more certainty and <strong>mitigate risks</strong> stemming from <strong>seasonal demand</strong>, <strong>regulatory changes</strong>, and <strong>fuel price swings</strong>.</p> <div><hr /></div> <h2><strong>B) Why This Matters for India's Energy Ecosystem</strong></h2> <h3>1. <strong>Aligns with India’s Green Energy Goals:</strong></h3> <p>As per the <strong>Niti Aayog</strong>, India needs over <strong>$250 billion in green investments annually</strong> till 2047 to meet its <strong>net-zero goals</strong>. NSE’s electricity futures can play a critical role by attracting <strong>global climate-focused investors</strong> to participate in a <strong>regulated</strong>, <strong>transparent</strong>, and <strong>hedged energy market</strong>.</p> <h3>2. <strong>Empowers Power Sector Stakeholders:</strong></h3> <p>From <strong>power producers</strong> to <strong>discoms</strong> and <strong>bulk buyers</strong>, every player can benefit from <strong>more accurate price signals</strong> and <strong>risk management tools</strong> — a step toward better <strong>planning and capital allocation</strong>.</p> <h3>3. <strong>Bridges the Gap in Price Volatility Management:</strong></h3> <p><strong>Electricity pricing in India is highly volatile</strong> due to <strong>monsoon dependence</strong>, <strong>grid issues</strong>, and <strong>fuel costs</strong>. <strong>Monthly futures contracts</strong> offer a robust way to <strong>hedge these fluctuations</strong>.</p> <div><hr /></div> <h2><strong>C) How NSE’s Entry Disrupts the Status Quo</strong></h2> <p>Until now, platforms like <strong>IEX (Indian Energy Exchange)</strong> have dominated India’s power trading, mainly in the <strong>Day Ahead Market (DAM)</strong> and <strong>Real Time Market (RTM)</strong>. However, <strong>NSE entering this segment with a derivatives offering</strong> changes the game.</p> <h3><strong>Key differences:</strong></h3> <ul data-spread="false"> <li> <p><strong>IEX focuses on spot markets</strong>, while <strong>NSE introduces longer-term price stability</strong>.</p> </li> <li> <p><strong>NSE’s deep institutional network and tech infrastructure</strong> could attract <strong>large-scale traders</strong> and <strong>global funds</strong>.</p> </li> <li> <p>This also complements <strong>NSE’s overall strategy</strong> of expanding into <strong>newer asset classes</strong> beyond <strong>equities</strong> and <strong>currencies</strong>.</p> </li> </ul> <div><hr /></div> <h2><strong>D) Industry Implications: Bullish for NSE, Beneficial for the Market</strong></h2> <p>The <strong>SEBI approval</strong> reflects confidence in <strong>NSE’s regulatory framework</strong>, <strong>risk management</strong>, and <strong>technology backbone</strong>.</p> <h3><strong>For investors</strong>, this move:</h3> <ul data-spread="false"> <li> <p><strong>Strengthens NSE’s positioning</strong> as a <strong>multi-asset class exchange</strong></p> </li> <li> <p>Opens opportunities to invest in <strong>energy-linked financial instruments</strong></p> </li> <li> <p>Adds a layer of <strong>maturity to India’s energy markets</strong></p> </li> </ul> <p>It also complements India’s <strong>Electricity Act, 2003</strong> reforms that aim for <strong>better competition</strong>, <strong>transparency</strong>, and <strong>market-based pricing</strong>.</p> <div><hr /></div> <h2><strong>Conclusion</strong></h2> <p>NSE’s foray into <strong>electricity futures</strong> is more than just another product launch — it marks a <strong>structural shift</strong> in India’s power market. By bridging the gap between <strong>renewable ambitions</strong> and <strong>financial infrastructure</strong>, the exchange is enabling <strong>smarter</strong>, <strong>climate-aligned investments</strong>.</p> <p>As the transition to <strong>clean energy</strong> accelerates, <strong>NSE</strong> is positioning itself at the <strong>intersection of finance and sustainability</strong> — and that’s a story both <strong>institutional and retail investors</strong> will want to watch closely.</p>

<p>India’s <strong>largest depository</strong>, <strong>National Securities Depository Limited (NSDL)</strong>, is all set to enter the public markets in <strong>July 2025</strong> with an <strong>IPO expected in the ₹750–₹800 range</strong>. This move will value the company at a whopping <strong>₹15,000–₹16,000 crore</strong>.</p> <p>While the buzz is real due to NSDL’s strong legacy and market infrastructure dominance, <strong>investors must dig deeper before diving in.</strong></p> <div><hr /></div> <h3>A) NSDL Business Model: <strong>India’s Capital Market Backbone</strong></h3> <p>Founded in <strong>1996</strong>, NSDL was India’s first depository and remains the largest, facilitating seamless electronic holding and settlement of securities.</p> <p><strong>Core Services Include:</strong></p> <ul data-spread="false"> <li> <p><strong>Demat Account Services</strong> (via Depository Participants)</p> </li> <li> <p><strong>Clearing & Settlement</strong> of securities</p> </li> <li> <p><strong>Corporate Action Processing</strong></p> </li> <li> <p><strong>Pledge/Unpledge Mechanism</strong></p> </li> <li> <p><strong>e-Voting & KYC Authentication</strong></p> </li> <li> <p><strong>Digital Record-Keeping & Vault Services</strong></p> </li> </ul> <p><strong>Clientele</strong>: Exchanges, brokers, custodians, mutual funds, and institutional investors — making NSDL a <strong>systemically important financial utility</strong>.</p> <div><hr /></div> <h3>B) Revenue Sources of NSDL</h3> <p>NSDL’s business model offers <strong>diverse, recurring and market-linked revenue streams:</strong></p> <ol start="1" data-spread="false"> <li> <p><strong>Issuer Charges</strong> – For corporate actions & dematerialization/rematerialization</p> </li> <li> <p><strong>Transaction Fees</strong> – Volume/value-linked settlement fees</p> </li> <li> <p><strong>Account Maintenance</strong> – Paid by DPs and investors</p> </li> <li> <p><strong>e-Gov Services</strong> – PAN, Aadhaar & KYC processing (via NSDL e-Gov Infra)</p> </li> <li> <p><strong>Technology Solutions</strong> – Software & IT infrastructure</p> </li> </ol> <p><strong>👉 NSDL = Institutional Heavy. CDSL = Retail Heavy.</strong></p> <div><hr /></div> <h3>C) NSDL Financial Performance (FY22–FY25)</h3> <table style="width: 67.5353%;"> <tbody> <tr> <th style="width: 41.7467%; text-align: center;"><strong>Metric</strong></th> <th style="width: 16.4216%; text-align: center;"><strong>FY22</strong></th> <th style="width: 17.1293%; text-align: center;"><strong>FY23</strong></th> <th style="width: 14.9882%; text-align: center;"><strong>FY24</strong></th> <th style="width: 9.63524%; text-align: center;"><strong>FY25</strong></th> </tr> <tr> <td style="width: 41.7467%; text-align: center;"><strong>Revenue (₹ Cr)</strong></td> <td style="width: 16.4216%; text-align: center;">761</td> <td style="width: 17.1293%; text-align: center;">1,022</td> <td style="width: 14.9882%; text-align: center;">1,268</td> <td style="width: 9.63524%; text-align: center;">1,420</td> </tr> <tr> <td style="width: 41.7467%; text-align: center;"><strong>EBITDA (₹ Cr)</strong></td> <td style="width: 16.4216%; text-align: center;">240</td> <td style="width: 17.1293%; text-align: center;">255</td> <td style="width: 14.9882%; text-align: center;">285</td> <td style="width: 9.63524%; text-align: center;">375</td> </tr> <tr> <td style="width: 41.7467%; text-align: center;"><strong>PAT (₹ Cr)</strong></td> <td style="width: 16.4216%; text-align: center;">212</td> <td style="width: 17.1293%; text-align: center;">235</td> <td style="width: 14.9882%; text-align: center;">275</td> <td style="width: 9.63524%; text-align: center;">343</td> </tr> <tr> <td style="width: 41.7467%; text-align: center;"><strong>EBITDA Margin (%)</strong></td> <td style="width: 16.4216%; text-align: center;">31.5</td> <td style="width: 17.1293%; text-align: center;">24.9</td> <td style="width: 14.9882%; text-align: center;">22.5</td> <td style="width: 9.63524%; text-align: center;">26.4</td> </tr> <tr> <td style="width: 41.7467%; text-align: center;"><strong>PAT Margin (%)</strong></td> <td style="width: 16.4216%; text-align: center;">27.9</td> <td style="width: 17.1293%; text-align: center;">23.0</td> <td style="width: 14.9882%; text-align: center;">21.7</td> <td style="width: 9.63524%; text-align: center;">24.2</td> </tr> <tr> <td style="width: 41.7467%; text-align: center;"><strong>EPS (₹)</strong></td> <td style="width: 16.4216%; text-align: center;">53.0</td> <td style="width: 17.1293%; text-align: center;">11.75</td> <td style="width: 14.9882%; text-align: center;">13.75</td> <td style="width: 9.63524%; text-align: center;">17.15</td> </tr> </tbody> </table> <p><strong>1. Revenue CAGR:</strong> ~23% over FY22–FY25<br /><br /><strong>2. Margin Pressure:</strong> FY22 to FY24 decline due to rising costs, partial recovery in FY25</p> <div><hr /></div> <h3>D) IPO Valuation: High Price, Low Comfort?</h3> <p>With <strong>expected pricing at ₹750–₹800</strong>, the implied valuation is:</p> <ul data-spread="false"> <li> <p><strong>P/E Ratio: ~44x FY25 EPS</strong> (₹17.15)</p> </li> </ul> <p><strong>Comparison:</strong></p> <ul data-spread="false"> <li> <p><strong>CDSL trades at ~65x FY25 EPS</strong></p> </li> <li> <p><strong>CDSL MCap: ₹34,800 Cr+</strong>, with much stronger retail base</p> </li> <li> <p><strong>NSDL IPO Valuation: ₹14,000–₹15,000 Cr (expected)</strong></p> </li> <li> <p><strong>Current Unlisted Market Cap: ₹25,500 Cr</strong> (UnlistedZone)</p> </li> </ul> <p><strong>Weak Points :</strong></p> <ul data-spread="false"> <li> <p><strong>Lower Retail Penetration</strong>: NSDL ~3 Cr accounts vs. <strong>CDSL 8.5 Cr+</strong></p> </li> <li> <p><strong>Lower Tech Automation</strong> = Higher Cost Base</p> </li> <li> <p><strong>Stiff IPO Pricing</strong> = Limited short-term upside</p> </li> </ul> <div><hr /></div> <h3>E) NSDL vs CDSL: The Face-Off</h3> <table style="width: 67.3922%;"> <tbody> <tr> <td style="width: 31.6839%; text-align: center;"><strong>Parameter</strong></td> <td style="width: 36.0678%; text-align: center;"><strong>NSDL</strong></td> <td style="width: 32.0824%; text-align: center;"><strong>CDSL</strong></td> </tr> <tr> <td style="width: 31.6839%; text-align: center;"><strong>Founded</strong></td> <td style="width: 36.0678%; text-align: center;">1996</td> <td style="width: 32.0824%; text-align: center;">1999</td> </tr> <tr> <td style="width: 31.6839%; text-align: center;"><strong>Promoter</strong></td> <td style="width: 36.0678%; text-align: center;">NSE , IDBI</td> <td style="width: 32.0824%; text-align: center;">BSE (51% stake)</td> </tr> <tr> <td style="width: 31.6839%; text-align: center;"><strong>Demat Accounts</strong></td> <td style="width: 36.0678%; text-align: center;">~3 crore</td> <td style="width: 32.0824%; text-align: center;">8.5+ crore</td> </tr> <tr> <td style="width: 31.6839%; text-align: center;"><strong>FY25 PAT Estimate</strong></td> <td style="width: 36.0678%; text-align: center;">₹343 crore</td> <td style="width: 32.0824%; text-align: center;">₹526 crore</td> </tr> <tr> <td style="width: 31.6839%; text-align: center;"><strong>IPO/MCap Valuation</strong></td> <td style="width: 36.0678%; text-align: center;">₹14,000–15,000 Cr (est.)</td> <td style="width: 32.0824%; text-align: center;">₹34000+ Cr</td> </tr> <tr> <td style="width: 31.6839%; text-align: center;"><strong>Revenue Orientation</strong></td> <td style="width: 36.0678%; text-align: center;">Institution-Driven</td> <td style="width: 32.0824%; text-align: center;">Retail-Heavy</td> </tr> <tr> <td style="width: 31.6839%; text-align: center;"><strong>Tech Efficiency</strong></td> <td style="width: 36.0678%; text-align: center;">Medium</td> <td style="width: 32.0824%; text-align: center;">High (automation-first)</td> </tr> <tr> <td style="width: 31.6839%; text-align: center;"><strong>Investor Appeal</strong></td> <td style="width: 36.0678%; text-align: center;">Moderate</td> <td style="width: 32.0824%; text-align: center;">Strong</td> </tr> </tbody> </table> <p><strong>CDSL has the edge in growth, reach, and valuation comfort.</strong></p> <div><hr /></div> <h3>F) Final Verdict: Quality Business, Expensive Entry Point</h3> <p>NSDL offers rock-solid fundamentals, regulatory credibility, and a strong growth history. But the <strong>high valuation in the unlisted market leaves little room for making return.</strong> </p> <p><strong>UnlistedZone Take:</strong></p> <ul data-spread="false"> <li> <p>Fundamentals: ✔️</p> </li> <li> <p>Market Infrastructure Leadership: ✔️</p> </li> <li> <p>Valuation Comfort: ❌</p> </li> <li> <p>Retail Momentum: ❌</p> </li> </ul> <p><strong> Wait for listing and price correction before investing.</strong></p> <div><hr /></div> <h3>Stay Tuned</h3> <p><strong>Follow UnlistedZone for exclusive updates and in-depth IPO analysis.</strong> </p>

<div><strong>Introduction</strong></div> <p>HDB Financial Services Ltd., the NBFC arm of HDFC Bank, is preparing for a landmark IPO estimated at <strong>₹12,500 crore (~$1.5 billion)</strong>, likely to be launched by <strong>mid-July 2025</strong>. This IPO isn't just another fundraising event — it’s driven by a regulatory mandate from the <strong>Reserve Bank of India (RBI)</strong>, which requires "Upper Layer" NBFCs to be listed by <strong>September 2025</strong>.</p> <p>With the <strong>UDRHP filing underway</strong> and anchor discussions in progress, investors are now asking: <em>Is HDB Financial Services fairly valued or is the premium already priced in?</em></p> <div><hr /></div> <h3>IPO Valuation Range and Unlisted Price</h3> <p>The IPO is expected to value HDB Financial Services between <strong>₹65,000 to ₹70,000 crore</strong>, implying a <strong>price band in the range of ₹820 to ₹880 per share</strong>. This estimate is based on internal investor presentations and peer valuation comparisons.</p> <p>However, in the unlisted market, HDB shares are <strong>trading above ₹1,200</strong>, implying a <strong>valuation north of ₹95,000 crore</strong> — a steep 35–40% premium over expected IPO pricing. This disconnect could mean one of two things:</p> <ul data-spread="false"> <li> <p>A potential <strong>listing day disappointment</strong> for those buying at elevated unlisted prices</p> </li> <li> <p>Or, optimistic investors <strong>betting on long-term compounding</strong> from a high-quality lending franchise</p> </li> </ul> <div><hr /></div> <h3>Financial Performance Snapshot (FY22–FY25)</h3> <table> <tbody> <tr> <th>Metric</th> <th>FY22</th> <th>FY23</th> <th>FY24</th> <th>FY25</th> </tr> <tr> <td>Interest Earned (₹ Cr)</td> <td>8,362</td> <td>8,928</td> <td>11,157</td> <td>13,836</td> </tr> <tr> <td>PAT (₹ Cr)</td> <td>1,011</td> <td>1,959</td> <td>2,461</td> <td>2,176</td> </tr> <tr> <td>EPS (₹)</td> <td>12.79</td> <td>24.75</td> <td>31.03</td> <td>27.34</td> </tr> <tr> <td>Net NPA (%)</td> <td>2.29</td> <td>2.72</td> <td>1.90</td> <td>2.26</td> </tr> <tr> <td>Book Value (₹)</td> <td>120.69</td> <td>144.51</td> <td>173.27</td> <td>198.79</td> </tr> <tr> <td>P/B (unlisted)</td> <td>6.01</td> <td>4.57</td> <td>6.90</td> <td>5.01</td> </tr> <tr> <td>ROE (%)</td> <td>10.6</td> <td>17.13</td> <td>17.91</td> <td>13.75</td> </tr> <tr> <td>Provisions (₹ Cr)</td> <td>2,465</td> <td>1,330</td> <td>1,067</td> <td>2,113</td> </tr> </tbody> </table> <p><strong>Note:</strong> FY25 profitability was impacted by a sharp rise in <strong>provisions and contingencies</strong>, which increased to <strong>₹2,113 crore</strong>, up nearly 100% over FY24. This rise in provisioning was likely precautionary amid macro uncertainty or portfolio stress, which <strong>dragged PAT down to ₹2,176 crore</strong> despite a strong 24% jump in interest income.</p> <p>This indicates that while core business remains strong, credit cost fluctuations can impact earnings trajectory — something investors should monitor in the run-up to IPO.</p> <h3>Valuation Concerns: Is the Premium Justified?</h3> <p>As per FY25 projected book value of <strong>₹198.79</strong>, the implied P/B at the upper IPO band of ₹880 comes to around <strong>4.4x</strong>. In contrast:</p> <ul data-spread="false"> <li> <p><strong>Most listed NBFCs</strong> like Cholamandalam, L&T Finance, and Mahindra Finance <strong>trade between 2.5x–5x P/B</strong></p> </li> <li> <p>Even high-quality players like Bajaj Finance have traded near these levels during consolidation periods</p> </li> </ul> <p>At <strong>5x+ P/B in the unlisted market</strong>, HDB Financial is priced <strong>like a premium lender</strong>, even though it has:</p> <ul data-spread="false"> <li> <p>No banking license</p> </li> <li> <p>Slower loan growth compared to peers</p> </li> <li> <p>Moderate ROE trajectory</p> </li> </ul> <p>This raises caution for investors entering at elevated levels in the secondary market.</p> <div><hr /></div> <h3>Regulatory Backing and Growth Potential</h3> <p>Despite valuation concerns, HDB enjoys:</p> <ul data-spread="false"> <li> <p><strong>Parentage of HDFC Bank</strong>, India’s most trusted private lender</p> </li> <li> <p>Deep distribution in semi-urban and underbanked regions</p> </li> <li> <p>Diversified loan book with strong presence in vehicle finance, personal loans, and SME lending</p> </li> </ul> <p>Additionally, the <strong>regulatory push for listing</strong> ensures full compliance and governance transparency, which could unlock future lending headroom.</p> <div><hr /></div> <h3>Conclusion</h3> <p>The HDB Financial IPO is a rare opportunity to invest in a scaled NBFC backed by India’s top private bank. However, <strong>valuation caution is warranted</strong> — especially for those buying in the unlisted space where the pricing appears rich.</p> <p>If the IPO is priced in the <strong>₹820–₹880 band</strong>, it may offer <strong>reasonable entry</strong> for long-term investors. But those holding unlisted shares above ₹1,200 should <strong>temper listing day expectations</strong> or be ready for the long haul.</p> <p><strong>UnlistedZone Recommendation:</strong> Wait for the IPO price band announcement. If you're already invested in unlisted shares, monitor anchor investor interest closely. If you're evaluating entry, compare P/B ratios and ROE profiles with listed peers.</p>
<h2 data-pm-slice="1 1 []">Introduction</h2> <p>PowerUp Money Secures $7.1M Seed Funding to Transform WealthTech! PowerUp Money, a fresh entrant in India’s burgeoning WealthTech landscape, has successfully raised $7.1 million in its first institutional round led by Accel, Blume Ventures, and Kae Capital. This marks a significant milestone as the Bengaluru-based startup prepares for rapid scale-up.</p> <h2>A) Company Background & Founding</h2> <p><strong>Founded:</strong> Early 2025 ( In 2023 it founded under the Uni cards, become Independent in 2025)</p> <p><strong>Founder & CEO:</strong> Prateek Jindal, a seasoned fintech leader and ex-co‑founder of Uni Cards<br /><strong>Origin:</strong> Incubated within Uni Cards, PowerUp was spun off as an independent entity post-funding </p> <h2>B) Business Model & Revenue Strategy</h2> <p>PowerUp operates as a Registered Investment Advisor (RIA), offering:</p> <ul data-spread="false"> <li> <p><strong>Free</strong> advisory & portfolio management</p> </li> <li> <p><strong>PowerUp Elite subscription</strong> (₹999/year) featuring quarterly reviews and premium insights</p> </li> </ul> <p><strong> Revenue is projected from:</strong></p> <ul data-spread="false"> <li> <p>Subscription fees</p> </li> <li> <p>Full-service portfolio management in the future</p> </li> </ul> <p><strong>How It Stands Out:</strong><br />Competes with Dezerv, Centricity, Groww (Fisdom), and Ionic Wealth, but differentiates via tech-first, advisory‑driven offerings targeting ₹0.5–2 Cr investors</p> <h2>C) Founders & Team</h2> <p><strong>Prateek Jindal</strong> brings fintech and product expertise from Uni Cards, Ola Money, and Swvl<br />Supported by a <strong>30–35 strong team</strong> with strengths in investment research, data science, and mobile UX</p> <h2>D) Problem Being Solved</h2> <p>Only 55 million Indians currently have mutual fund exposure</p> <p><strong>Gap:</strong> Lack of trustworthy, personalized advisory and digital-first, commission-free products</p> <p><strong>PowerUp’s solution:</strong> Democratize institutional‑grade guidance with a user‑centric experience</p> <h2>E) Funding History & Valuation</h2> <p><strong>1. Seed Round (June 2025)</strong><br /><strong>Amount:</strong> $7.1 million (~₹59 Cr)</p> <p><strong>2. Lead Investors:</strong> Accel, Blume Ventures, Kae Capital<br /><strong>Others:</strong> 8i Ventures, DeVC</p> <p><strong>3. Estimated Valuation:</strong><br />Though undisclosed, early-stage startups like PowerUp typically fetch valuations between <strong>₹250–350 Cr</strong>.</p> <h2>F) Growth Plans & Competitive Edge</h2> <p><strong>Using funds to:</strong></p> <ul data-spread="false"> <li> <p>Expand research capabilities</p> </li> <li> <p>Enhance product features</p> </li> <li> <p>Scale up user acquisition</p> </li> </ul> <p><strong>Competitive advantage:</strong><br /><br />Unveiling a hybrid model: “free + premium advisory + tech-driven portfolio services”. Positioned to cater to affluent retail investors (₹5 L to ₹2 Cr segments)</p> <h2>UnlistedZone Takeaway</h2> <p>PowerUp Money emerges as one of India’s new compelling WealthTech startups in 2025. With a credible founding team, proven product-market fit, and significant backing, it’s may take a strong fight with RIA & digital investment advisory space.</p> <p>💡 <strong>Watch out for this startup—it’s one to watch in India’s next wave of fintech innovation.</strong></p>
<h3 data-pm-slice="1 1 []">Introduction:</h3> <p>Garuda Aerospace, one of India’s leading drone startups, has once again made headlines with a fresh $1 million funding infusion from the Narotam Sekhsaria Family Office. This new capital injection, following its $12 million raise in April 2025, further solidifies its position as a dominant force in the drone tech sector. With total funding reaching $21 million, Garuda is set to enhance production, invest in R&D, and expand internationally. Here’s a closer look at the company’s trajectory, business focus, and what this means for the industry.</p> <div><hr /></div> <h3>A) Funding Highlights</h3> <ol start="1" data-spread="false"> <li> <p><strong>Latest Funding (June 2025):</strong> $1 million</p> </li> <li> <p><strong>Lead Investor:</strong> Narotam Sekhsaria Family Office</p> </li> <li> <p><strong>Other Participants:</strong> Existing investors, including We Founder Circle (WFC)</p> </li> <li> <p><strong>Previous Round:</strong> Raised $12 million in April 2025</p> </li> <li> <p><strong>Total Funding Till Date:</strong> $21 million</p> </li> </ol> <div><hr /></div> <h3>B) Use of Funds</h3> <ol start="1" data-spread="false"> <li> <p><strong>Manufacturing Expansion:</strong> Scale production from 8,000 to 12,000–15,000 drones annually</p> </li> <li> <p><strong>R&D Investment:</strong> Fuel innovation and develop new drone technologies</p> </li> <li> <p><strong>Export Plans:</strong> Target to operate in 50 countries by end of 2025</p> </li> </ol> <div><hr /></div> <h3>C) Company Overview</h3> <ul data-spread="false"> <li> <p><strong>Founded:</strong> 2015</p> </li> <li> <p><strong>Headquarters:</strong> Chennai, India</p> </li> <li> <p><strong>Founder & CEO:</strong> Agnishwar Jayaprakash</p> </li> <li> <p><strong>Product Portfolio:</strong> 30+ drone models</p> </li> <li> <p><strong>Operational Scale:</strong> 400 drones and over 500 trained pilots</p> </li> <li> <p><strong>Clientele:</strong> Over 75 marquee clients including Tata, Adani, Reliance, Swiggy, Flipkart, Delhivery, L&T, and various government bodies</p> </li> </ul> <div><hr /></div> <h3>D) Revenue Model</h3> <p>Garuda operates on a dual revenue stream:</p> <ol start="1" data-spread="false"> <li> <p><strong>Drone Product Sales:</strong> Customized industrial and agri drones</p> </li> <li> <p><strong>Drone-as-a-Service (DAAS):</strong> On-demand drone services and pilot training programs</p> </li> </ol> <div><hr /></div> <h3>E) Business Focus</h3> <ul data-spread="false"> <li> <p><strong>Agriculture:</strong> Currently contributes ~70% of the company's revenue</p> </li> <li> <p><strong>Defense & Government Contracts:</strong> Growing vertical with upcoming domestic and international opportunities</p> </li> </ul> <div><hr /></div> <h3>F) Financial Snapshot</h3> <ul data-spread="false"> <li> <p><strong>FY24 Revenue:</strong> ₹132 crore</p> </li> <li> <p><strong>Net Profit:</strong> ₹20 crore</p> </li> <li> <p><strong>Profitability:</strong> The company has maintained profitability over the past few years</p> </li> </ul> <div><hr /></div> <h3>🔍 UnlistedZone Takeaway:</h3> <p>Garuda Aerospace is more than just a drone maker; it’s an innovation-driven enterprise with a strong commercial footprint across agriculture, logistics, and defense. The back-to-back funding rounds in 2025 highlight investor confidence in Garuda's tech-first, scalable model. With an ambitious export roadmap and consistent profitability, the company is well-positioned to become a global drone leader.</p> <p><strong>Verdict:</strong> A high-potential private player to watch in India's growing drone economy. Stay tuned with UnlistedZone for exclusive updates on Garuda's journey toward potential IPO or next strategic milestone.</p> <div><hr /></div>

<h3 data-start="342" data-end="358">Introduction</h3> <p data-start="360" data-end="683">Most farmers in India still sell their crops in mandis (agricultural markets). But in recent years, the government has been pushing for <strong data-start="496" data-end="523">digital and modern ways</strong> of selling produce. One such platform is <strong data-start="565" data-end="573">NERL</strong> (National E-Repository Limited), which allows farmers to store their crops in warehouses and trade digitally.</p> <p data-start="685" data-end="866">Recently, NERL’s <strong data-start="702" data-end="721">unlisted shares</strong> have started trading in the grey market. This has caught the attention of investors. But what exactly does NERL do, and is it a good investment?</p> <p data-start="868" data-end="929">Let’s understand step by step — in simple, everyday language.</p> <hr data-start="931" data-end="934" /> <h2 data-start="936" data-end="960">1. What Does NERL Do?</h2> <p data-start="962" data-end="1257">National E-Repository Limited (NERL) was established in 2017 and received its official registration from the Warehousing Development and Regulatory Authority (WDRA) in August of the same year. It was set up with the objective of creating a nationwide electronic repository system for agricultural commodities. <br /><br />The platform enables the issuance and management of <strong>electronic Negotiable Warehouse Receipts </strong>(eNWRs), helping <strong>farmers, traders, and institutions</strong> to securely hold and trade commodities stored in WDRA-registered warehouses. NERL is promoted by the National Commodity and Derivatives Exchange (NCDEX), which holds the majority stake and oversees operational execution. <br /><br />It is also backed by some of India’s most credible financial institutions, including <strong>NABARD</strong> (National Bank for Agriculture and Rural Development), which plays a key role in promoting agricultural finance and infrastructure. In addition, major banks like<strong> ICICI Bank, State Bank of India (SBI), and HDFC Bank</strong> are among its stakeholders, offering both financial strength and institutional credibility to the platform. <br /><br />Together, these backers provide NERL with the required infrastructure, policy alignment, and trust to support the long-term transformation of agricultural trading in India. NERL is a company that allows farmers to store their crops in government-approved warehouses. Once the crops are stored, NERL gives a digital receipt called an eNWR (electronic Negotiable Warehouse Receipt). This eNWR works like proof that the crop is safely stored in the warehouse.</p> <p data-start="1259" data-end="1284">The farmer or trader can:</p> <ul data-start="1286" data-end="1441"> <li data-start="1286" data-end="1334"> <p data-start="1288" data-end="1334"><strong data-start="1288" data-end="1317">Take a loan from the bank</strong> using this eNWR.</p> </li> <li data-start="1335" data-end="1381"> <p data-start="1337" data-end="1381"><strong data-start="1337" data-end="1360">Sell the crop later</strong> when prices improve.</p> </li> <li data-start="1382" data-end="1441"> <p data-start="1384" data-end="1441"><strong data-start="1384" data-end="1407">Avoid distress sale</strong> at low rates during harvest time.</p> </li> </ul> <h3 data-start="1443" data-end="1455">Example:</h3> <p data-start="1457" data-end="1725">Ramesh, a farmer, stores 100 quintals of wheat in a warehouse. He receives an eNWR through NERL. Instead of selling his crop immediately, he takes a loan from a bank using this receipt and waits 2 months. When the market price increases, he sells and earns more money.</p> <hr data-start="1727" data-end="1730" /> <h2 data-start="1732" data-end="1784">2. Why Do Farmers Still Prefer Selling in Mandis?</h2> <p data-start="1786" data-end="1880">Even though warehouse systems like NERL are available, most farmers still sell in mandis. Why?</p> <ul data-start="1882" data-end="2216"> <li data-start="1882" data-end="1961"> <p data-start="1884" data-end="1961"><strong data-start="1884" data-end="1901">Quick Payment</strong>: In mandis, farmers get cash or bank transfer the same day.</p> </li> <li data-start="1962" data-end="2070"> <p data-start="1964" data-end="2070"><strong data-start="1964" data-end="1977">Old Habit</strong>: Farmers have been going to mandis for decades. They trust the system and know how it works.</p> </li> <li data-start="2071" data-end="2136"> <p data-start="2073" data-end="2136"><strong data-start="2073" data-end="2091">Less Awareness</strong>: Many farmers are not aware of NERL or eNWR.</p> </li> <li data-start="2137" data-end="2216"> <p data-start="2139" data-end="2216"><strong data-start="2139" data-end="2158">Distance Issues</strong>: Sometimes the nearest warehouse is far from the village.</p> </li> </ul> <h3 data-start="2218" data-end="2230">Example:</h3> <p data-start="2232" data-end="2445">Sunita, a farmer in Bihar, prefers selling in the local mandi. She doesn’t have a smartphone or internet connection and isn’t aware of how warehouse trading works. For her, mandi is the easiest and fastest option.</p> <hr data-start="2447" data-end="2450" /> <h2 data-start="2452" data-end="2511">3. What Are the Benefits of Selling via NERL Warehouses?</h2> <p data-start="2513" data-end="2569">For farmers who use NERL, there are multiple advantages:</p> <ul data-start="2571" data-end="2881"> <li data-start="2571" data-end="2652"> <p data-start="2573" data-end="2652"><strong data-start="2573" data-end="2590">Loan Facility</strong>: Farmers can get loans using eNWR without selling their crop.</p> </li> <li data-start="2653" data-end="2739"> <p data-start="2655" data-end="2739"><strong data-start="2655" data-end="2672">Better Prices</strong>: They can wait for the right time and sell when prices are higher.</p> </li> <li data-start="2740" data-end="2808"> <p data-start="2742" data-end="2808"><strong data-start="2742" data-end="2758">Safe Storage</strong>: Crops are stored in clean, protected warehouses.</p> </li> <li data-start="2809" data-end="2881"> <p data-start="2811" data-end="2881"><strong data-start="2811" data-end="2833">Proof of Ownership</strong>: Digital receipts help build financial records.</p> </li> </ul> <h3 data-start="2883" data-end="2895">Example:</h3> <p data-start="2897" data-end="3178">Kavita Devi stores 50 quintals of soybean in a warehouse at Rs. 4,000 per quintal. She waits for two months and sells at Rs. 4,800 per quintal. She also takes a short-term loan using eNWR to cover her medical expenses during this time. She earns more and avoids selling in a hurry.</p> <hr data-start="3180" data-end="3183" /> <h2 data-start="3185" data-end="3222">4. Why Isn’t NERL Used Widely Yet?</h2> <p data-start="3224" data-end="3309">While NERL is a smart system, it still has limited adoption across India. Here's why:</p> <ul data-start="3311" data-end="3601"> <li data-start="3311" data-end="3375"> <p data-start="3313" data-end="3375"><strong data-start="3313" data-end="3334">Lack of awareness</strong>: Many farmers have not even heard of it.</p> </li> <li data-start="3376" data-end="3461"> <p data-start="3378" data-end="3461"><strong data-start="3378" data-end="3398">Fewer warehouses</strong>: Government-approved warehouses are not present in every area.</p> </li> <li data-start="3462" data-end="3529"> <p data-start="3464" data-end="3529"><strong data-start="3464" data-end="3479">Bank delays</strong>: Some banks are slow to process eNWR-based loans.</p> </li> <li data-start="3530" data-end="3601"> <p data-start="3532" data-end="3601"><strong data-start="3532" data-end="3547">Digital gap</strong>: Not all farmers are comfortable with online systems.</p> </li> </ul> <h3 data-start="3603" data-end="3615">Example:</h3> <p data-start="3617" data-end="3797">A farmer group in Jharkhand tried using NERL, but the warehouse was 80 km away, and the bank took 3 weeks to approve their loan. They switched back to the traditional mandi system.</p> <hr data-start="3799" data-end="3802" /> <h2 data-start="3804" data-end="3855">5. What Is the Government Doing to Promote NERL?</h2> <p data-start="3857" data-end="3945">The government is trying to push warehouse-based trading and NERL through several steps:</p> <ul data-start="3947" data-end="4332"> <li data-start="3947" data-end="4023"> <p data-start="3949" data-end="4023"><strong data-start="3949" data-end="3969">Interest subsidy</strong>: Farmers pay less interest on loans taken using eNWR.</p> </li> <li data-start="4024" data-end="4133"> <p data-start="4026" data-end="4133"><strong data-start="4026" data-end="4047">Linking with eNAM</strong>: NERL is being connected to the national agri market (eNAM) for better trade options.</p> </li> <li data-start="4134" data-end="4237"> <p data-start="4136" data-end="4237"><strong data-start="4136" data-end="4165">Training farmers and FPOs</strong>: Farmers and organisations are being trained to use warehouse receipts.</p> </li> <li data-start="4238" data-end="4332"> <p data-start="4240" data-end="4332"><strong data-start="4240" data-end="4259">More warehouses</strong>: Private companies are being allowed to set up WDRA-approved warehouses.</p> </li> </ul> <h3 data-start="4334" data-end="4346">Example:</h3> <p data-start="4348" data-end="4524">In Maharashtra, a pilot program helped 500 farmers sell crops digitally through NERL and eNAM. They earned 15–20% more than mandi prices, with timely payments and no middlemen.</p> <hr data-start="4526" data-end="4529" /> <h2 data-start="4531" data-end="4581">6. Should You Invest in NERL’s Unlisted Shares?</h2> <p data-start="4583" data-end="4720">In the last few months, NERL shares have started trading in the <strong data-start="4647" data-end="4666">unlisted market</strong>. Investors are now curious whether it’s worth buying.</p> <h3 data-start="4722" data-end="4746">Reasons to Consider:</h3> <ul data-start="4748" data-end="5064"> <li data-start="4748" data-end="4835"> <p data-start="4750" data-end="4835"><strong data-start="4750" data-end="4777">Future-focused business</strong>: Agri warehousing and digital trade are growing in India.</p> </li> <li data-start="4836" data-end="4904"> <p data-start="4838" data-end="4904"><strong data-start="4838" data-end="4864">Backed by institutions</strong>: NERL is supported by NCDEX and NABARD.</p> </li> <li data-start="4905" data-end="4980"> <p data-start="4907" data-end="4980"><strong data-start="4907" data-end="4925">Policy support</strong>: Government is pushing for better agri infrastructure.</p> </li> <li data-start="4981" data-end="5064"> <p data-start="4983" data-end="5064"><strong data-start="4983" data-end="5008">First-mover advantage</strong>: Very few players are licensed to issue eNWRs in India.</p> </li> </ul> <h3 data-start="5066" data-end="5076">Risks:</h3> <ul data-start="5078" data-end="5256"> <li data-start="5078" data-end="5102"> <p data-start="5080" data-end="5102">No confirmed IPO date.</p> </li> <li data-start="5103" data-end="5150"> <p data-start="5105" data-end="5150">Financials are still in bad shape due to no growth.</p> </li> <li data-start="5151" data-end="5190"> <p data-start="5153" data-end="5190">Low liquidity in the unlisted market.</p> </li> <li data-start="5191" data-end="5256"> <p data-start="5193" data-end="5256">Success depends on how quickly farmers adopt warehouse trading.</p> </li> </ul> <hr data-start="5258" data-end="5261" /> <h2 data-start="5263" data-end="5276">Conclusion</h2> <p data-start="5278" data-end="5529">NERL may not be a "fast-return" stock, but it has strong potential as a <strong data-start="5350" data-end="5374">long-term investment</strong>. The business is in the early stages, but it is aligned with government policies, farmer interest, and India's need for better agriculture infrastructure.</p> <p data-start="5531" data-end="5791">If you are a patient investor looking for early opportunities in India's growing AgriTech sector, <strong data-start="5629" data-end="5680">NERL unlisted shares could be worth considering</strong>. But make sure to do your research, understand the risks, and invest only what you can hold for the long term.</p>

<h3 data-pm-slice="1 3 []">Introduction</h3> <p>Rapido, widely known for its bike taxi services, is preparing to enter India’s crowded but fast-growing food delivery space. With a fresh funding round of ₹125 crore (~$15 million) from Nexus Venture Partners and a reported valuation of $1.1 billion, the company is positioning itself as a serious challenger to Zomato and Swiggy — India’s food delivery duopoly.</p> <p>The key question now is: <strong>Can Rapido break the cycle of high commissions, frustrated delivery partners, and dissatisfied restaurants — and rewrite the rules of food delivery in India?</strong></p> <div><hr /></div> <h3>1. Strategic Shift: From Bike Taxis to Biryani</h3> <p>Rapido made its mark by targeting a segment left underserved by Ola and Uber — two-wheeler drivers. By offering <strong>fixed pricing</strong>, <strong>better rider incentives</strong>, and <strong>lower commissions</strong>, it attracted a large fleet of drivers tired of the unpredictability of gig work. This rider-first approach gave Rapido a loyal and scalable supply-side base.</p> <p>Now, it’s applying the same formula to food delivery, this time targeting <strong>restaurants and end consumers</strong>.</p> <div><hr /></div> <h3>2. Lower Commission, Simpler Pricing: Rapido’s Value Proposition</h3> <p>One of the biggest pain points for restaurants on Swiggy and Zomato is the <strong>high commission rate</strong>, often ranging from <strong>16% to 30%</strong>, combined with opaque terms and ad-driven visibility algorithms.</p> <p>In contrast, <strong>Rapido is offering a flat 8–15% commission</strong>, and a <strong>transparent delivery fee for consumers</strong>:</p> <ul data-spread="false"> <li> <p>₹25 for orders below ₹400</p> </li> <li> <p>₹50 for orders above ₹400</p> </li> </ul> <p>This approach provides <strong>predictability for both restaurants and customers</strong>, creating a more sustainable ecosystem.</p> <div><hr /></div> <h3>3. Restaurant Community Welcomes the Move</h3> <p>Rapido has already signed terms with the <strong>National Restaurant Association of India (NRAI)</strong>, signalling strong industry support.</p> <p>Over the past year, restaurant owners have increasingly voiced their frustration on platforms like LinkedIn, calling out:</p> <ul data-spread="false"> <li> <p>“Zero payout” orders</p> </li> <li> <p>“Mystery charges”</p> </li> <li> <p>Ad-based listing pressures</p> </li> <li> <p>Loss of customer data and brand control</p> </li> </ul> <p>Rapido’s entry is being seen by many as a much-needed alternative that prioritizes <strong>unit economics over platform control</strong>.</p> <div><hr /></div> <h3>4. Impact on Incumbents: Zomato and Swiggy React</h3> <p>Following Rapido’s announcement of its pilot rollout in Bengaluru (expected June–July 2025), both <strong>Zomato and Swiggy shares dropped between 2.5%–4%</strong>. Investors clearly understand that even a small shift in market dynamics — especially one that puts pricing pressure on commissions — can lead to significant margin compression for the incumbents.</p> <p>This isn’t the first time Rapido has disrupted incumbents. Its tie-up with idle-time Swiggy riders for last-mile delivery shows its willingness to collaborate and compete at the same time — a classic asymmetric playbook.</p> <div><hr /></div> <h3>5. Market Potential: A $15 Billion Opportunity</h3> <p>India’s food delivery market is currently estimated at <strong>$6–7 billion</strong>, but is expected to reach <strong>$15 billion by 2029</strong>, growing at a CAGR of <strong>20–30%</strong>.</p> <p>What’s even more striking is that food delivery accounts for <strong>only ~11% of total food consumption</strong> in India, compared to:</p> <ul data-spread="false"> <li> <p>40% in China</p> </li> <li> <p>58% in the United States</p> </li> </ul> <p>This indicates massive headroom for growth. With urbanisation, time-poor households, and smartphone penetration rising, the next wave of growth will likely come from <strong>Tier 2 and Tier 3 cities</strong> — where Rapido already has brand presence via its bike taxi business.</p> <div><hr /></div> <h3>6. Rapido’s Unique Edge: Trust and Affordability</h3> <p>Unlike the heavily VC-backed burn models of the past, Rapido is betting on <strong>trust, fairness, and simplicity</strong>:</p> <ul data-spread="false"> <li> <p>Fixed pricing for riders (bike taxi success)</p> </li> <li> <p>Lower commissions for restaurants (food delivery pilot)</p> </li> <li> <p>Predictable charges for customers (no surprise fees)</p> </li> </ul> <p>This <strong>three-way alignment</strong> could become its biggest competitive moat.</p> <div><hr /></div> <h3>7. Risks and Challenges</h3> <p>However, the path is not without risk. Key challenges include:</p> <ul data-spread="false"> <li> <p>Customer acquisition in an already saturated space</p> </li> <li> <p>Restaurant onboarding and last-mile delivery SLAs</p> </li> <li> <p>Competing against Zomato/Swiggy’s deep pockets and loyalty programs</p> </li> <li> <p>Managing operational efficiency at scale</p> </li> </ul> <p>The pilot in Bengaluru will serve as a key litmus test for the model.</p> <div><hr /></div> <h3>Conclusion: Can Rapido Become India’s Third Food Delivery Giant?</h3> <p>Rapido’s expansion into food delivery is not just another startup pivot — it’s a <strong>deliberate strike at structural inefficiencies</strong> in India’s hyper-competitive food tech landscape.</p> <p>With restaurant and rider communities increasingly vocal about unfair terms from incumbents, and investors hungry for sustainable business models, <strong>Rapido may just be in the right place at the right time</strong>.</p> <p>The next 6–12 months will determine whether this playbook scales — and whether <strong>Rapido's unlisted valuation of $1.1 billion</strong> continues to rise as India’s digital consumer economy expands.</p> <div><hr /></div>
<h3 data-pm-slice="1 1 []">Introduction</h3> <p>The Ministry of Power is initiating consultations to implement <strong>Market Coupling</strong> across India's power exchanges — a move that could significantly alter the market dynamics. Currently, the <strong>Indian Energy Exchange (IEX)</strong> dominates the electricity trading landscape with over 90% market share, while <strong>Power Exchange India Limited (PXIL)</strong> and newer players account for the remaining share.</p> <p>The proposed market coupling mechanism could <strong>dismantle the pricing advantage</strong> enjoyed by IEX and offer a <strong>level playing field</strong> to smaller exchanges like PXIL. In this article, we explore what market coupling means, how it works, and why it could disrupt the status quo in India’s power trading ecosystem.</p> <div><hr /></div> <h3>What is Market Coupling?</h3> <p>Market Coupling refers to a <strong>centralised mechanism</strong> where a <strong>single agency or market coupling operator (MCO)</strong> collects bids from all participating power exchanges and then determines a <strong>uniform market clearing price</strong> based on aggregated demand and supply.</p> <p>Under the current model, each exchange — IEX, PXIL, and others — conducts <strong>independent price discovery</strong> through its own auction system. This leads to slight variations in prices and liquidity across platforms. With market coupling, however, all orders flow into a central pool, and the <strong>same price and volume are allocated across all exchanges</strong>.</p> <p>The concept is borrowed from European power markets, where market coupling ensures better efficiency, optimal resource allocation, and transparent pricing.</p> <div><hr /></div> <h3>Why Market Coupling Is a Concern for IEX</h3> <p>IEX has built its leadership on <strong>deep liquidity, superior price discovery, and trader confidence</strong>. With the introduction of market coupling:</p> <ul data-spread="false"> <li> <p><strong>IEX will no longer control price discovery</strong>, as a central agency will handle it.</p> </li> <li> <p>Its <strong>dominance in volumes may face dilution</strong>, as other exchanges get equal access to trades.</p> </li> <li> <p>The platform becomes a <strong>pass-through</strong> system rather than a price-setter, reducing its strategic edge.</p> </li> </ul> <p>In essence, IEX’s role shifts from being the market’s “brain” to just another “interface,” which may impact <strong>its margins, brand power, and growth narrative</strong>.</p> <div><hr /></div> <h3>Why Market Coupling Is a Tailwind for PXIL</h3> <p>For <strong>PXIL</strong>, which has struggled to gain significant market share due to IEX’s dominance, market coupling presents a <strong>strategic opportunity</strong>:</p> <ul data-spread="false"> <li> <p><strong>Price parity with IEX</strong> eliminates one of PXIL’s biggest disadvantages.</p> </li> <li> <p><strong>Participants may prefer PXIL</strong> for reasons like lower transaction fees, better user interface, or integration with their systems.</p> </li> <li> <p>As long as the <strong>final clearing price is same across platforms</strong>, smaller players can now compete more aggressively.</p> </li> </ul> <p>This could lead to <strong>volume growth</strong>, improved visibility, and potentially <strong>better financial performance</strong> for PXIL over the long term.</p> <div><hr /></div> <h3>Industry Reactions and Strategic Implications</h3> <p>Initial industry reactions have been mixed. While smaller exchanges and independent power producers welcome the move, IEX’s investors and market participants are closely watching how the consultation process unfolds. The drop in IEX’s share price following the announcement is a reflection of the <strong>uncertainty and perceived negative impact</strong>.</p> <p>If implemented well, market coupling could lead to:</p> <ul data-spread="false"> <li> <p><strong>More competitive and transparent electricity markets</strong></p> </li> <li> <p><strong>Higher participation from industrial buyers</strong></p> </li> <li> <p><strong>Reduced monopolistic tendencies in price discovery</strong></p> </li> </ul> <p>However, the <strong>success of market coupling will depend on the design of the central system</strong>, governance rules, and how existing exchanges adapt.</p> <div><hr /></div> <h3>Conclusion</h3> <p>The government’s plan to introduce market coupling could become a <strong>defining moment in India’s power trading history</strong>. While it poses a challenge to IEX’s long-standing dominance, it opens the door for smaller exchanges like PXIL to scale up and compete more effectively.</p> <p>Investors in both listed and unlisted power sector plays must watch this space closely. As regulatory frameworks evolve, <strong>market positioning may shift faster than expected</strong>.</p>

<p data-pm-slice="1 3 []">The Indian Premier League (IPL), once considered a mere cricketing spectacle, has now evolved into one of the most lucrative sports leagues globally. With recent news of Diageo exploring a potential $2 billion sale of Royal Challengers Bengaluru (RCB), the spotlight is again on the astronomical valuations of IPL franchises. But while this may grab headlines, it opens up a deeper conversation for savvy investors—particularly those active in the unlisted markets—on why Chennai Super Kings (CSK) may be severely undervalued.</p> <div><hr /></div> <h3>1) A Brief History of IPL and Its Financial Evolution</h3> <p><strong>2008–2015: The Foundation Years</strong></p> <ul data-spread="false"> <li> <p>IPL was launched in 2008 by the BCCI with a vision to combine sports with entertainment and commercial monetisation.</p> </li> <li> <p>Team auctions brought in big industrialists and celebrities (e.g., Mukesh Ambani, Shah Rukh Khan, Vijay Mallya), and player auctions became a spectacle.</p> </li> <li> <p>Media rights were initially sold to Sony for ₹8,200 crore (2008–2017), which laid the groundwork for IPL’s commercial success.</p> </li> </ul> <p><strong>2016–2017: Transitional Phase</strong></p> <ul data-spread="false"> <li> <p>Two-year suspension of CSK and RR over conflict of interest led to temporary teams like Gujarat Lions and Rising Pune Supergiant.</p> </li> <li> <p>This phase tested IPL’s brand strength—yet surprisingly, the league continued to thrive, proving its long-term commercial appeal.</p> </li> </ul> <p><strong>2018–2022: The Star Era Begins</strong></p> <ul data-spread="false"> <li> <p>Star India bought IPL broadcasting rights for ₹16,348 crore for 5 years (₹3,270 crore per year).</p> </li> <li> <p>This deal nearly doubled IPL’s per-match media value, solidifying its place as a global sporting brand.</p> </li> <li> <p>Franchise valuations started shooting up—CSK, MI, and KKR began commanding significant market interest, including in the unlisted space.</p> </li> </ul> <p><strong>2023–2027: The Digital Gold Rush</strong></p> <ul data-spread="false"> <li> <p>IPL rights were auctioned again and this time split between digital and TV.</p> </li> <li> <p>Disney Star (TV) and Viacom18 (Digital) acquired rights for a combined ₹48,390 crore, valuing each match at ₹118 crore—second only to the NFL globally.</p> </li> <li> <p>This immense monetisation opportunity made IPL franchises akin to mini unicorns, attracting investors, PE firms, and global corporates.</p> </li> </ul> <div><hr /></div> <h3>2) Monetisation Model: Why Franchises Are Now Billion-Dollar Brands</h3> <p>IPL franchises have 4 primary revenue streams:</p> <ol start="1" data-spread="false"> <li> <p><strong>Central Media Pool</strong>: BCCI shares 50% of broadcasting revenue with the teams.</p> </li> <li> <p><strong>Sponsorships</strong>: Brands pay hefty sums to become jersey/title sponsors.</p> </li> <li> <p><strong>Ticket Sales</strong>: Direct revenue during home games.</p> </li> <li> <p><strong>Merchandise & Licensing</strong>: Growing every year with fanbase expansion.</p> </li> </ol> <p>This robust model ensures stable cash flows, making franchise ownership a high-ROI asset. RCB, despite never having won a title until 2025, commands a $2 billion valuation today, showing how strong fan engagement and monetisation can offset on-field performance.</p> <div><hr /></div> <h3>3) CSK Is Likely Undervalued in the Unlisted Market</h3> <p>As of June 2025, <strong>CSK’s unlisted share price at UnlistedZone reflects a market cap of around ₹7500 crore</strong> (approx. $1 billion). Compared to RCB’s $2 billion headline valuation, this seems starkly undervalued, especially considering:</p> <ul data-spread="false"> <li> <p><strong>CSK has won 5 IPL titles</strong> (tied with MI for most titles).</p> </li> <li> <p><strong>Consistently profitable</strong>: Among few IPL teams to report regular profitability.</p> </li> <li> <p><strong>Brand Loyalty</strong>: Led by MS Dhoni, CSK has a cult following across age groups and geographies.</p> </li> <li> <p><strong>Stable management</strong>: Owned by India Cements, CSK's structure is more mature compared to recently restructured teams.</p> </li> <li> <p><strong>Likely IPO candidate</strong>: CSK has strong financials and regulatory readiness for listing, which would lead to immediate value unlocking.</p> </li> </ul> <div><hr /></div> <h3>4) Valuation Comparison: CSK vs RCB</h3> <table style="width: 63.5626%; height: 128.333px;"> <tbody> <tr style="height: 18.3333px;"> <th style="text-align: center; width: 30.7144%; height: 18.3333px;">Particulars</th> <th style="text-align: center; width: 37.535%; height: 18.3333px;">CSK (Unlisted)</th> <th style="text-align: center; width: 31.6672%; height: 18.3333px;">RCB (RCB Stake News)</th> </tr> <tr style="height: 36.6667px;"> <td style="text-align: center; width: 30.7144%; height: 36.6667px;">Estimated Valuation</td> <td style="text-align: center; width: 37.535%; height: 36.6667px;">₹7500 crore (<$1B)</td> <td style="text-align: center; width: 31.6672%; height: 36.6667px;">$2 billion</td> </tr> <tr style="height: 18.3333px;"> <td style="text-align: center; width: 30.7144%; height: 18.3333px;">IPL Titles</td> <td style="text-align: center; width: 37.535%; height: 18.3333px;">5</td> <td style="text-align: center; width: 31.6672%; height: 18.3333px;">1</td> </tr> <tr style="height: 18.3333px;"> <td style="text-align: center; width: 30.7144%; height: 18.3333px;">Profitability</td> <td style="text-align: center; width: 37.535%; height: 18.3333px;">Profitable</td> <td style="text-align: center; width: 31.6672%; height: 18.3333px;">Not Consistently Profitable</td> </tr> <tr style="height: 18.3333px;"> <td style="text-align: center; width: 30.7144%; height: 18.3333px;">Fan Following</td> <td style="text-align: center; width: 37.535%; height: 18.3333px;">Pan-India + Global (Dhoni)</td> <td style="text-align: center; width: 31.6672%; height: 18.3333px;">High (Virat Kohli-led)</td> </tr> <tr style="height: 18.3333px;"> <td style="text-align: center; width: 30.7144%; height: 18.3333px;">IPO Potential</td> <td style="text-align: center; width: 37.535%; height: 18.3333px;">Very High</td> <td style="text-align: center; width: 31.6672%; height: 18.3333px;">Unclear</td> </tr> </tbody> </table> <p><strong>Conclusion</strong>: CSK offers a better financial and brand profile at half the price. This makes it a compelling long-term investment in the unlisted space.</p> <div><hr /></div> <h3>5) Global Investor Interest & What It Means for You</h3> <p>The sale buzz around RCB is not isolated. Global investors, hedge funds, and family offices are increasingly tracking IPL franchises. For example:</p> <ul data-spread="false"> <li> <p>CVC Capital invested in Gujarat Titans (new team).</p> </li> <li> <p>RedBird Capital owns a stake in Rajasthan Royals.</p> </li> <li> <p>PE firms from the US and UK are exploring franchise-level private investments.</p> </li> </ul> <p>This tells us one thing—<strong>IPL is no longer just a cricket league; it’s a serious global business asset class</strong>.</p> <div><hr /></div> <h3>💡 UnlistedZone View</h3> <p>As India’s leading pre-IPO investment platform, we believe <strong>CSK represents a unique value opportunity</strong>. While RCB’s potential stake sale rightly grabs attention, <strong>CSK’s fundamentals, championship history, and media monetisation edge make it a better investment bet at current valuations</strong>.</p> <p>👉 For investors interested in participating in such high-growth sports assets, CSK shares are available on UnlistedZone.</p> <p>📞 Reach out to us to know:</p> <ul data-spread="false"> <li> <p>Latest price trends</p> </li> <li> <p>Lot sizes and delivery process</p> </li> <li> <p>Exit options before potential IPO</p> </li> </ul> <div><hr /></div> <h3>🔍 Final Takeaway</h3> <ul data-spread="false"> <li> <p>IPL’s valuation boom is real and sustainable.</p> </li> <li> <p>Media rights, digital viewership, and global investor participation are fuelling this momentum.</p> </li> <li> <p>RCB’s $2 billion tag should prompt investors to re-evaluate CSK’s position in their unlisted portfolio.</p> </li> <li> <p>At UnlistedZone, we help you stay ahead in capturing such hidden value stories before they hit the mainstream market.</p> </li> </ul>
<h2 data-pm-slice="1 1 []">A) Introduction</h2> <p>Power Exchange India Limited (PXIL), a government-regulated power trading platform, is increasingly drawing investor interest in the unlisted market. At a time when India is focusing on energy market reforms, investments in power exchanges like PXIL are being closely watched for long-term value creation.</p> <p>In this article, we explore PXIL’s business model, compare it with IEX (its larger rival), assess its financials, and understand why institutional investors are now eyeing PXIL’s unlisted shares.</p> <div><hr /></div> <h2>B) What is PXIL and What Does It Do?</h2> <p>PXIL is a power exchange that enables <strong>buyers (industries, DISCOMs, large commercial users)</strong> and <strong>sellers (power generators, solar/wind firms)</strong> to <strong>transact electricity in a transparent, market-driven manner</strong>.</p> <p>It facilitates:</p> <ul data-spread="false"> <li> <p><strong>Day-Ahead and Term-Ahead Market (DAM & TAM)</strong>: Short-term contracts for power trading scheduled either the next day (DAM) or days/weeks ahead (TAM).</p> </li> <li> <p><strong>Renewable Energy Certificates (RECs)</strong>: Instruments that help obligated entities (like DISCOMs) meet their renewable purchase obligations by buying clean energy credits.</p> </li> <li> <p><strong>Market-Based Economic Dispatch (MBED)</strong>: A reform to optimize electricity dispatch across India based on lowest cost generation regardless of state boundaries.</p> </li> </ul> <p>Buyers place bids, sellers offer power, and trades are cleared based on matching prices. PXIL acts as an <strong>exchange</strong>, ensuring <strong>price discovery, transparency</strong>, and <strong>grid discipline</strong>.</p> <div><hr /></div> <h2>C) Who Uses PXIL?</h2> <ul data-spread="false"> <li> <p><strong>DISCOMs</strong> (Distribution Companies)</p> </li> <li> <p><strong>Large Industrial Users</strong> (textile, cement, steel plants)</p> </li> <li> <p><strong>Renewable Energy Producers</strong></p> </li> <li> <p><strong>Power Traders</strong></p> </li> </ul> <div><hr /></div> <h2>D) PXIL vs. IEX: What's the Difference?</h2> <table style="width: 55.6173%;"> <tbody> <tr> <th style="text-align: center; width: 40.5%;">Feature</th> <th style="text-align: center; width: 35.55%;">PXIL</th> <th style="text-align: center; width: 23.85%;">IEX</th> </tr> <tr> <td style="text-align: center; width: 40.5%;">Market Share</td> <td style="text-align: center; width: 35.55%;">~5–10%</td> <td style="text-align: center; width: 23.85%;">~90%+</td> </tr> <tr> <td style="text-align: center; width: 40.5%;">Founded</td> <td style="text-align: center; width: 35.55%;">2008</td> <td style="text-align: center; width: 23.85%;">2008</td> </tr> <tr> <td style="text-align: center; width: 40.5%;">Ownership</td> <td style="text-align: center; width: 35.55%;">JV of NSE & NCDEX</td> <td style="text-align: center; width: 23.85%;">Public listed company</td> </tr> <tr> <td style="text-align: center; width: 40.5%;">Trading Volume</td> <td style="text-align: center; width: 35.55%;">Lower</td> <td style="text-align: center; width: 23.85%;">Industry leader</td> </tr> <tr> <td style="text-align: center; width: 40.5%;">Tech Infrastructure</td> <td style="text-align: center; width: 35.55%;">Moderate</td> <td style="text-align: center; width: 23.85%;">Highly advanced</td> </tr> </tbody> </table> <p>PXIL is <strong>structurally similar</strong> to IEX but has lower liquidity and volumes. However, regulatory efforts to prevent monopoly in power trading are creating opportunities for PXIL to grow.</p> <div><hr /></div> <h2>E) How Will You Get Power After Buying on PXIL?</h2> <p>A common confusion among buyers is — <em>if I buy power on PXIL, how will it reach me if my electricity connection is from the local DISCOM?</em></p> <p>Here’s how it works:</p> <ol start="1" data-spread="false"> <li> <p>PXIL matches buyer-seller on its platform.</p> </li> <li> <p>The <strong>power is scheduled through the national grid</strong>.</p> </li> <li> <p>DISCOMs or industries <strong>receive electricity physically via the existing transmission system</strong>.</p> </li> <li> <p><strong>POSOCO and SLDCs</strong> handle scheduling, metering, and settlements.</p> </li> </ol> <p>You get the benefit of market-discovered pricing, while power flows physically as usual.</p> <div><hr /></div> <h2>F) PXIL Financial Highlights (FY24)</h2> <table style="width: 34.189%;"> <tbody> <tr> <td style="text-align: center; width: 62.3428%;">Metric</td> <td style="text-align: center; width: 37.4846%;">Value</td> </tr> <tr> <td style="text-align: center; width: 62.3428%;"><strong>Unlisted Share Price</strong></td> <td style="text-align: center; width: 37.4846%;">₹345</td> </tr> <tr> <td style="text-align: center; width: 62.3428%;"><strong>Market Cap</strong></td> <td style="text-align: center; width: 37.4846%;">₹2,017 crore</td> </tr> <tr> <td style="text-align: center; width: 62.3428%;"><strong>Revenue (FY24)</strong></td> <td style="text-align: center; width: 37.4846%;">₹63 crore</td> </tr> <tr> <td style="text-align: center; width: 62.3428%;"><strong>PAT (FY24)</strong></td> <td style="text-align: center; width: 37.4846%;">₹22.1 crore</td> </tr> <tr> <td style="text-align: center; width: 62.3428%;"><strong>P/E Ratio</strong></td> <td style="text-align: center; width: 37.4846%;">91.76×</td> </tr> <tr> <td style="text-align: center; width: 62.3428%;"><strong>P/B Ratio</strong></td> <td style="text-align: center; width: 37.4846%;">19.88×</td> </tr> <tr> <td style="text-align: center; width: 62.3428%;"><strong>ROE</strong></td> <td style="text-align: center; width: 37.4846%;">24.05%</td> </tr> <tr> <td style="text-align: center; width: 62.3428%;"><strong>Book Value</strong></td> <td style="text-align: center; width: 37.4846%;">₹17.35/share</td> </tr> <tr> <td style="text-align: center; width: 62.3428%;"><strong>Debt/Equity</strong></td> <td style="text-align: center; width: 37.4846%;">0.16×</td> </tr> </tbody> </table> <p>🟢 <strong>Revenue Growth (FY22 to FY24):</strong> ₹40 Cr → ₹63 Cr<br /><br />🟢 <strong>PAT Growth (FY22 to FY24):</strong> ₹15.7 Cr → ₹22.1 Cr<br /><br />🟢 <strong>EPS Growth:</strong> ₹2.7 → ₹3.8</p> <p>These numbers showcase steady growth and profitability, even at a smaller scale.</p> <div><hr /></div> <h2>G) Why Are Institutions Looking at PXIL Now?</h2> <ol start="1" data-spread="false"> <li> <p><strong>Regulatory Tailwinds</strong>: SEBI and CERC are actively pushing for competition in power markets.</p> </li> <li> <p><strong>Diversification</strong>: PXIL's smaller base allows faster growth compared to IEX.</p> </li> <li> <p><strong>Government Reforms</strong>: Focus on MBED and open access trading will increase participation.</p> </li> <li> <p><strong>Limited Unlisted Float</strong>: Scarcity of shares is driving valuation interest.</p> </li> <li> <p><strong>Potential IPO in Future</strong>: With increased activity, PXIL could explore public listing as a value unlock.</p> </li> </ol> <div><hr /></div> <h2>H) Real-World Use Case</h2> <p>A steel manufacturer buys power via PXIL at ₹3.80/unit instead of the ₹6.50/unit charged by the local DISCOM. It saves crores annually via <strong>open access</strong>, while still receiving power through the state grid. PXIL enables this cost arbitrage transparently.</p> <div><hr /></div> <h2>I) Growth Potential</h2> <p>India’s power demand is expected to <strong>double by 2030</strong>. With reforms promoting <strong>market-based pricing</strong>, PXIL’s transaction volumes could rise substantially. As demand for clean energy and flexible trading grows, PXIL is poised to benefit from:</p> <ul data-spread="true"> <li> <p><strong>Carbon Credits</strong>: As India moves toward net-zero emissions, a carbon trading market is expected to be introduced. PXIL can serve as a platform for buying/selling carbon credits, tapping into a completely new revenue stream.</p> </li> <li> <p><strong>Green Power Trading</strong>: With increased renewable energy mandates, more entities will look to buy green power. PXIL can enable real-time green energy trading, especially through Renewable Energy Certificates (RECs).</p> </li> <li> <p><strong>Real-Time and Spot Markets</strong>: With growing digitization and smart metering, real-time market participation is increasing. PXIL can serve as an efficient platform for managing demand-supply imbalances instantly.</p> </li> </ul> <p>These initiatives not only add new revenue lines but also improve the relevance of PXIL in India’s evolving energy landscape.</p> <div><hr /></div> <h2>J) Investment Rationale for PXIL Unlisted Shares</h2> <p>✅ Niche but growing market with regulatory push<br /><br />✅ Profitable and debt-light business<br /><br />✅ High ROE and EPS growth<br /><br />✅ Plays on India’s energy transition<br /><br />✅ Unlisted scarcity premium</p> <div><hr /></div> <h2>Conclusion</h2> <p>PXIL may not have the scale of IEX, but its strategic positioning in a <strong>reforming and expanding market</strong> offers a compelling <strong>high-risk, high-reward</strong> opportunity for investors in the unlisted space.</p> <p>With valuations at ~₹2,000 crore and a rising interest in power market liberalisation, PXIL stands as a hidden gem in India’s unlisted ecosystem.</p> <div><hr /></div> <p><strong>Want to invest in PXIL unlisted shares?</strong><br />Visit <a href="https://www.unlistedzone.com">www.unlistedzone.com</a> or contact us to know more.</p> <div><hr /></div>

<h2 data-pm-slice="1 1 []">Introduction</h2> <p>Tata Capital is set to become the latest Tata Group company to hit the stock market. With SEBI’s approval process nearly complete, India is bracing for one of its biggest IPOs in the financial services space—valued at nearly $2 billion (₹17,200 crore). This public offering holds not only regulatory importance but also market-shaping potential.</p> <p>In this article, we explore the Tata Capital IPO news, financials, expected price band, and caution for unlisted market investors.</p> <div><hr /></div> <h2>A) Tata Capital IPO: Regulatory Green Signal Soon</h2> <p>As per reports, the Securities and Exchange Board of India (SEBI) has concluded its review of Tata Capital’s draft red herring prospectus (DRHP). The <strong>final observation letter</strong>, which signals regulatory clearance, is expected shortly. This would enable the Tata Group’s NBFC arm to go public ahead of the <strong>September 2025 deadline</strong> imposed by the RBI.</p> <h3>Why the Rush?</h3> <p>Tata Capital is part of the RBI’s <strong>‘Upper Layer’ of NBFCs</strong>, which mandates public listing for greater transparency and compliance. This IPO will help Tata Capital align with that directive.</p> <div><hr /></div> <h2>B) Tata Investment Shares React Strongly</h2> <p>Following the IPO news, <strong>Tata Investment Corporation shares surged 8%</strong>, hitting ₹7,150 on June 6. This surge reflects growing investor optimism that the IPO will unlock substantial value, not only for Tata Capital shareholders but across the Tata ecosystem.</p> <div><hr /></div> <h2>C) IPO Structure: Fresh Issue + OFS</h2> <p>The IPO is expected to feature a <strong>dual structure</strong>:</p> <ul data-spread="false"> <li> <p>🔄 <strong>Fresh Issue</strong> – To raise growth capital.</p> </li> <li> <p>🔁 <strong>Offer for Sale (OFS)</strong> – Providing partial exit to existing shareholders.</p> </li> </ul> <p>This combination will help Tata Capital bolster its balance sheet while giving early investors a profitable exit.</p> <div><hr /></div> <h2>D) Tata Capital Financial Highlights (FY25)</h2> <table style="width: 54.5338%;"> <tbody> <tr> <th style="text-align: center; width: 36.0479%;">Metric</th> <th style="text-align: center; width: 24.9743%;">FY24</th> <th style="text-align: center; width: 22.147%;">FY25</th> <th style="text-align: center; width: 16.7281%;">% Change</th> </tr> <tr> <td style="text-align: center; width: 36.0479%;">Total Income</td> <td style="text-align: center; width: 24.9743%;">₹18,198 Cr</td> <td style="text-align: center; width: 22.147%;">₹28,370 Cr</td> <td style="text-align: center; width: 16.7281%;">+55.91%</td> </tr> <tr> <td style="text-align: center; width: 36.0479%;">Total Expenses</td> <td style="text-align: center; width: 24.9743%;">₹13,506 Cr</td> <td style="text-align: center; width: 22.147%;">₹23,448 Cr</td> <td style="text-align: center; width: 16.7281%;">+73.63%</td> </tr> <tr> <td style="text-align: center; width: 36.0479%;">EBITDA</td> <td style="text-align: center; width: 24.9743%;">₹4,692 Cr</td> <td style="text-align: center; width: 22.147%;">₹4,922 Cr</td> <td style="text-align: center; width: 16.7281%;">+4.90%</td> </tr> <tr> <td style="text-align: center; width: 36.0479%;">Profit After Tax (PAT)</td> <td style="text-align: center; width: 24.9743%;">₹3,327 Cr</td> <td style="text-align: center; width: 22.147%;">₹3,655 Cr</td> <td style="text-align: center; width: 16.7281%;">+9.87%</td> </tr> <tr> <td style="text-align: center; width: 36.0479%;">EPS</td> <td style="text-align: center; width: 24.9743%;">₹8.98</td> <td style="text-align: center; width: 22.147%;">₹9.72</td> <td style="text-align: center; width: 16.7281%;">+8.23%</td> </tr> <tr> <td style="text-align: center; width: 36.0479%;">Gross NPA</td> <td style="text-align: center; width: 24.9743%;">1.71%</td> <td style="text-align: center; width: 22.147%;">2.33%</td> <td style="text-align: center; width: 16.7281%;">❌ Rising</td> </tr> <tr> <td style="text-align: center; width: 36.0479%;">Net NPA</td> <td style="text-align: center; width: 24.9743%;">0.38%</td> <td style="text-align: center; width: 22.147%;">0.98%</td> <td style="text-align: center; width: 16.7281%;">❌ Rising</td> </tr> </tbody> </table> <p>While Tata Capital reported <strong>strong top-line growth</strong>, a sharp increase in expenses and rising NPAs point to potential operational challenges.</p> <div><hr /></div> <h2>🚨 Caution for Unlisted Investors</h2> <p><strong>Expected IPO Price Band:</strong> ₹350–₹400 per share<br /><br /><strong>Current Unlisted Market Price:</strong> ₹1,000 per share</p> <p>⚠️ This means the unlisted shares are trading at nearly <strong>2.5x the expected IPO price</strong>.</p> <h3>🔍 Investor Advisory</h3> <ul data-spread="false"> <li> <p>There’s a <strong>valuation mismatch</strong>.</p> </li> <li> <p>No listing gain is likely if bought at current unlisted prices.</p> </li> <li> <p>Hype around the IPO is driving short-term demand in the grey market.</p> </li> </ul> <p>Investors must carefully assess whether to enter at inflated valuations or wait for listing.</p> <div><hr /></div> <h2>🔚 Conclusion</h2> <p>The Tata Capital IPO is a landmark move in India’s NBFC sector and could unlock significant value for the Tata Group. However, investors in the unlisted market must proceed with caution given the steep premium currently demanded.</p> <p>With FY25 financials showing growth but also early signs of stress in asset quality, prudent evaluation is key before taking positions in the pre-IPO market.</p> <div><hr /></div> <p><strong>Stay updated with all IPO news and pre-IPO research at </strong><a href="https://www.unlistedzone.com"><strong>UnlistedZone</strong></a></p> <p> </p>
<p><span style="font-weight: 400;">Tata Capital, one of India’s leading non-banking financial companies (NBFCs), has announced its audited financial results for the fiscal year ended March 31, 2025. The company reported yet another year of solid financial growth, backed by strong loan book expansion, higher income generation, and strategic cost management.</span></p> <h3><strong>A) Key Financial Highlights (YoY Performance)</strong></h3> <p><strong>1. Total Income</strong><span style="font-weight: 400;"> – Tata Capital’s total income in FY25 increased significantly by </span><strong>55.91%</strong><span style="font-weight: 400;">, reaching ₹28,370 crore, up from ₹18,198 crore in FY24. This growth was driven by a surge in interest earned and a rise in other income, reflecting the company’s expanding lending business and diversified revenue streams.</span></p> <p><strong>2. Total Expenses</strong><span style="font-weight: 400;"> – Total expenses in FY25 rose sharply to ₹23,448 crore (comprising Interest Expended, Operating Expenses, and Provisions), an increase of </span><strong>73.63%</strong><span style="font-weight: 400;"> from ₹13,506 crore in FY24. The rise reflects increased funding costs, operational scale-up, and proactive provisioning to safeguard asset quality.</span></p> <p><strong>B) EBITDA and Margins</strong></p> <p><strong>1. EBITDA</strong><span style="font-weight: 400;"> (approximated as Total Income minus Total Expenses) stood at ₹4,922 crore in FY25, compared to ₹4,692 crore in FY24, showing a modest rise of </span><strong>4.9%</strong><span style="font-weight: 400;">. The margin compression was primarily due to higher provisioning and interest expenses.</span></p> <p><strong>2. Profit After Tax (PAT)</strong><span style="font-weight: 400;"> – PAT rose to ₹3,655 crore in FY25, up from ₹3,327 crore in FY24, marking a growth of </span><strong>9.87%</strong><span style="font-weight: 400;">. The steady increase reflects disciplined cost control and strong revenue growth.</span></p> <p><strong>3. Earnings Per Share (EPS)</strong><span style="font-weight: 400;"> – EPS improved to ₹9.72 in FY25 from ₹8.98 in FY24, a growth of </span><strong>8.23%</strong><span style="font-weight: 400;">, indicating consistent shareholder value creation.</span></p> <h3><strong>C) Asset Quality</strong></h3> <p><strong>1. Gross NPA</strong><span style="font-weight: 400;"> increased to </span><strong>2.33%</strong><span style="font-weight: 400;"> in FY25, up from </span><strong>1.71%</strong><span style="font-weight: 400;"> in FY24, reflecting some stress in specific loan segments.</span><span style="font-weight: 400;"><br /><br /></span><strong>2. Net NPA</strong><span style="font-weight: 400;"> also rose to </span><strong>0.98%</strong><span style="font-weight: 400;"> from </span><strong>0.38%</strong><span style="font-weight: 400;">, but remained at manageable levels due to prudent provisioning.</span><span style="font-weight: 400;"><br /><strong><br />D) Key Financial Ratios</strong></span></p> <p><strong>1. Advances</strong><span style="font-weight: 400;"> grew from ₹1,57,760 crore in FY24 to ₹2,21,950 crore in FY25, registering an impressive </span><strong>40.66%</strong><span style="font-weight: 400;"> growth, indicating robust credit demand.</span><span style="font-weight: 400;"><br /></span></p> <p><strong>2. Book Value</strong><span style="font-weight: 400;"> increased to ₹91.36 in FY25 from ₹66.38 in FY24, up </span><strong>37.64%</strong><span style="font-weight: 400;">, enhancing the intrinsic value per share.</span><span style="font-weight: 400;"><br /><strong><br />3. P/B Ratio</strong> decreased to <strong>10.12</strong> from <strong>15.82</strong>, however, still valuation are very stretched. </span></p> <p><strong>4. Return on Equity (ROE)</strong><span style="font-weight: 400;"> moderated to </span><strong>10.63%</strong><span style="font-weight: 400;"> in FY25 from </span><strong>13.53%</strong><span style="font-weight: 400;"> in FY24, due to a higher equity base and increased provisioning.</span><span style="font-weight: 400;"><br /><strong><br />E) Valuation</strong></span></p> <p><span style="font-weight: 400;">Tata Capital is currently trading at a price-to-book (P/B) ratio of 11.57x, indicating a steep valuation. The IPO price is expected to be in the range of ₹350–₹400 per share.</span></p> <h3><strong>F) Strategic Outlook</strong></h3> <p><span style="font-weight: 400;">Tata Capital’s FY25 performance reflects its growing strength as a leading NBFC in India. With expanding credit penetration, digital transformation initiatives, and continued focus on retail and SME lending, the company is well-positioned to sustain its growth momentum.</span></p> <p><span style="font-weight: 400;">As the economy continues to formalize and credit demand rises across sectors, Tata Capital’s diversified portfolio, solid capital base, and strong governance framework provide a solid foundation for long-term value creation.</span></p>
Indicative prices, company research and your enquiries — in your pocket. Get price notes on the names you follow and reach our team from anywhere.


