
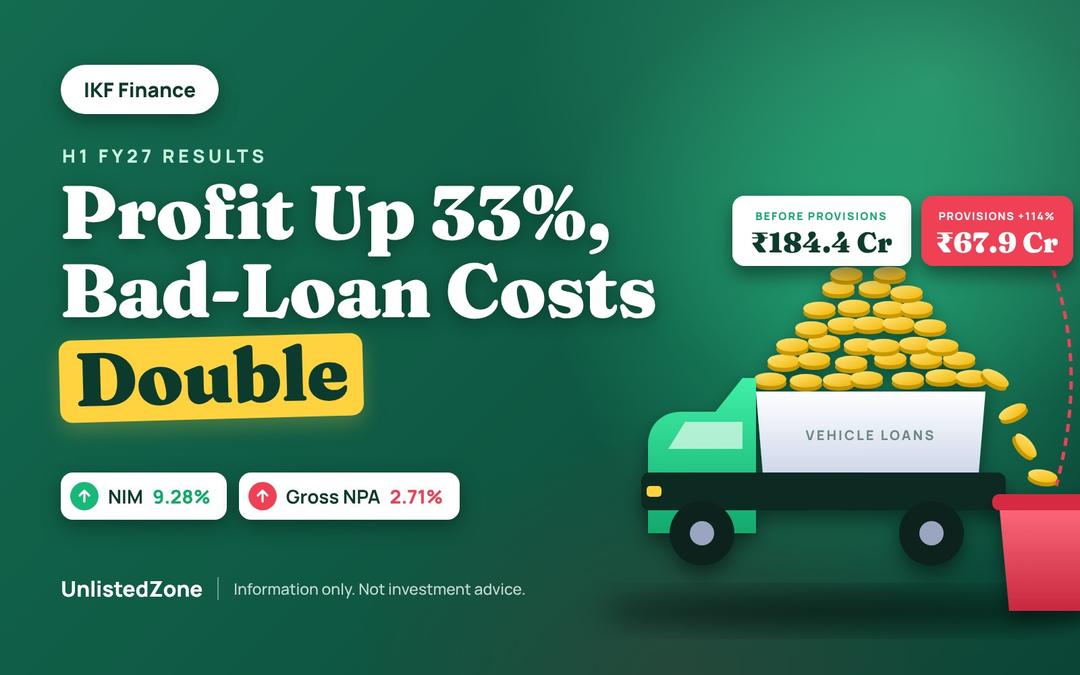
IKF Finance earned a profit of ₹86.6 Cr in H1 FY27 (Apr–Sep 2026), up 33% from ₹65.0 Cr in H1 FY26. Net interest income (NII) rose 50% to ₹288.4 Cr, and the annualised net interest margin (NIM) widened to 9.28% from 8.15%.
Provisions more than doubled to ₹67.9 Cr, so profit grew slower than core earnings. The loan book reached ₹6,634 Cr, up 34% in a year, while Gross NPA edged up to 2.71% from 2.48%.
Vijayawada-based IKF Finance is a middle-layer NBFC lending mainly against commercial vehicles, construction equipment and to small businesses (MSME). All figures below are standalone, unaudited and in ₹ crore unless stated.
NII grew 50% on a 31% larger average loan book, lifting NIM by 1.13 points; provisions grew faster still, so profit rose 33%.
₹ Cr | H1 FY26 | H1 FY27 | Change |
|---|---|---|---|
| Interest income | 392.9 | 539.9 | +37% |
| Fee & commission income | 3.4 | 1.1 | −68% |
| Gain/(loss) on loan assignment | 3.0 | (5.0) | n.m. |
| Fair value gains & other income | 7.5 | 10.6 | +41% |
| Total income | 406.9 | 546.6 | +34% |
| Finance cost | 200.1 | 251.5 | +26% |
| Net interest income (NII) | 192.8 | 288.4 | +50% |
| Average loan book | 4,730.1 | 6,212.1 | +31% |
| NIM (annualised) | 8.15% | 9.28% | +1.13 pts |
| Employee cost | 66.6 | 79.2 | +19% |
| Other expenses + D&A | 21.1 | 31.4 | +49% |
| Pre-provision operating profit | 119.1 | 184.4 | +55% |
| Provisions (impairment) | 31.8 | 67.9 | +114% |
| Credit cost (annualised) | 1.34% | 2.19% | +0.85 pts |
| Profit before tax | 87.4 | 116.5 | +33% |
| Tax | 22.3 | 29.8 | +34% |
| Profit after tax | 65.0 | 86.6 | +33% |
| EPS, basic (₹, not annualised) | 3.81 | 4.76 | +25% |
| Net profit margin | 15.98% | 15.85% | −0.13 pts |
| Cost-to-income | 42.4% | 37.5% | −4.9 pts |
NII = interest income less finance cost. Average loan book = average of net loans at the start and end of the half year: H1 FY26 uses Mar-25 (₹4,513.9 Cr) and Sep-25 (₹4,946.3 Cr); H1 FY27 uses Mar-26 (₹5,790.7 Cr) and Sep-26 (₹6,633.6 Cr). NIM = NII × 2 ÷ average loan book. Credit cost = provisions × 2 ÷ average loan book. Cost-to-income = operating costs ÷ (total income less finance cost). EPS is restated for the March 2026 share split (₹10 to ₹5 face value). n.m. = not meaningful.
Core earnings grew much faster than the loan book; higher provisions took away part of that gain.
Wider margin: Interest income on the average loan book rose to 17.4% (annualised) from 16.6%. Finance cost grew only 26%, so NIM rose to 9.28% from 8.15%.
Equity helped the margin: Net worth jumped from ₹988.5 Cr in Mar-25 to ₹1,798.8 Cr in Sep-25 after an equity raise. More of the loan book is funded by equity, which costs no interest.
Better cost control: Operating costs rose 26%, much slower than NII. Cost-to-income fell to 37.5% from 42.4%.
Provisions more than doubled: Impairment charges rose 114% to ₹67.9 Cr. Credit cost went up to 2.19% of the average loan book from 1.34%.
Assignment swung to a loss: Loan sales gave a ₹3.0 Cr gain in H1 FY26 but a ₹5.0 Cr loss in H1 FY27.
EPS grew 25%, slower than profit (+33%), because the shares issued in H1 FY26 count for the full period this year.
Gross NPA is 23 bps higher than a year ago, and capital adequacy has come down as borrowing funded the growth.
Sep-25 | Mar-26 | Sep-26 | |
|---|---|---|---|
| Gross NPA (Gross Stage-3) | 2.48% | 2.52% | 2.71% |
| Net NPA (Net Stage-3) | 1.66% | 1.69% | 1.82% |
| Provision coverage on Stage-3 | 33.64% | 33.58% | 33.56% |
| Capital adequacy | 30.86% | 27.34% | 24.11% |
| Debt-to-equity | 2.31x | 2.50x | 2.90x |
| Total debt to total assets | 68.60% | 70.19% | 73.14% |
| Liquidity coverage ratio | 594.07% | 495.73% | 338.02% |
NPA trend: Gross NPA rose from 2.48% to 2.71% in a year, with most of the rise in H1 FY27. The level is still low for a vehicle and MSME lender.
Thin coverage: Only about a third of Stage-3 loans are provided for. Recovery on the rest depends on the collateral behind these loans.
Co-lending book: Loans under 3 co-lending tie-ups total ₹163.2 Cr (IKF's and partners' shares together), of which ₹19.5 Cr (about 12%) is NPA. This is far higher than the company-wide 2.71%.
Capital: Capital adequacy has fallen from 30.9% to 24.1% in a year. It is still well above the RBI minimum of 15% for NBFCs.
The loan book grew to ₹6,634 Cr; borrowings rose 38%, much faster than net worth (+10%).
₹ Cr | Sep-25 | Mar-26 | Sep-26 | YoY |
|---|---|---|---|---|
| Loans (net) | 4,946.3 | 5,790.7 | 6,633.6 | +34% |
| Investments | 649.6 | 469.2 | 707.1 | +9% |
| Cash and bank balances | 349.2 | 352.6 | 373.7 | +7% |
| Total assets | 6,064.3 | 6,757.0 | 7,855.5 | +30% |
| Debt securities (NCDs) | 803.6 | 945.8 | 1,281.3 | +59% |
| Bank and other borrowings | 3,192.4 | 3,632.4 | 4,324.7 | +35% |
| Subordinated debt | 164.2 | 164.4 | 139.4 | −15% |
| Total borrowings | 4,160.2 | 4,742.6 | 5,745.4 | +38% |
| Net worth | 1,798.8 | 1,895.6 | 1,984.2 | +10% |
No fresh equity since Sep-25: Share capital is unchanged at ₹90.9 Cr. Net worth grew only from retained profit.
More market funding: NCDs rose 59% and now make up 22% of borrowings, up from 19% a year ago.
Liquidity: Cash, bank balances and investments of about ₹1,081 Cr give a comfortable buffer.
IKF's core earnings are growing fast; the open questions are credit cost and capital.
Provisions in H2 FY27: H1 credit cost of 2.19% compares with 1.34% a year ago. Whether H2 runs at a lower rate will largely decide full-year profit.
NIM durability: Part of the margin gain came from the equity raised in FY26. As debt-to-equity rises (2.90x from 2.31x), the margin may narrow.
NPA direction: Gross NPA rose 19 bps in H1 FY27 alone. A move above 3% would be a warning sign.
Assignment income: Loan sales gave ₹28.2 Cr of gains in FY26 but a loss in H1 FY27. This line can swing profit sharply.
Capital: With capital adequacy at 24.1% and the loan book up 34% in a year, growth at this pace may eventually need fresh equity.
New CEO: The board appointed Debnil Chakravarty as Chief Executive Officer for five years from 3 November 2026. He joined IKF in August 2024 and earlier worked with ICICI, Citi, SREI and South Indian Bank.
Source: IKF Finance Ltd, unaudited standalone results for the quarter and half year ended 30 September 2026, filed with BSE on 3 November 2026 (limited review by Mukund M. Chitale & Co., unmodified opinion); and IKF Finance Ltd, unaudited standalone results for the half year ended 30 September 2025, filed with BSE on 7 November 2025 (Mar-25 and Sep-25 balance sheet figures). Figures converted from ₹ lakh to ₹ crore; NII, average loan book, NIM, credit cost, operating profit and cost-to-income are UnlistedZone calculations.
This article is for information only and is not investment advice.