
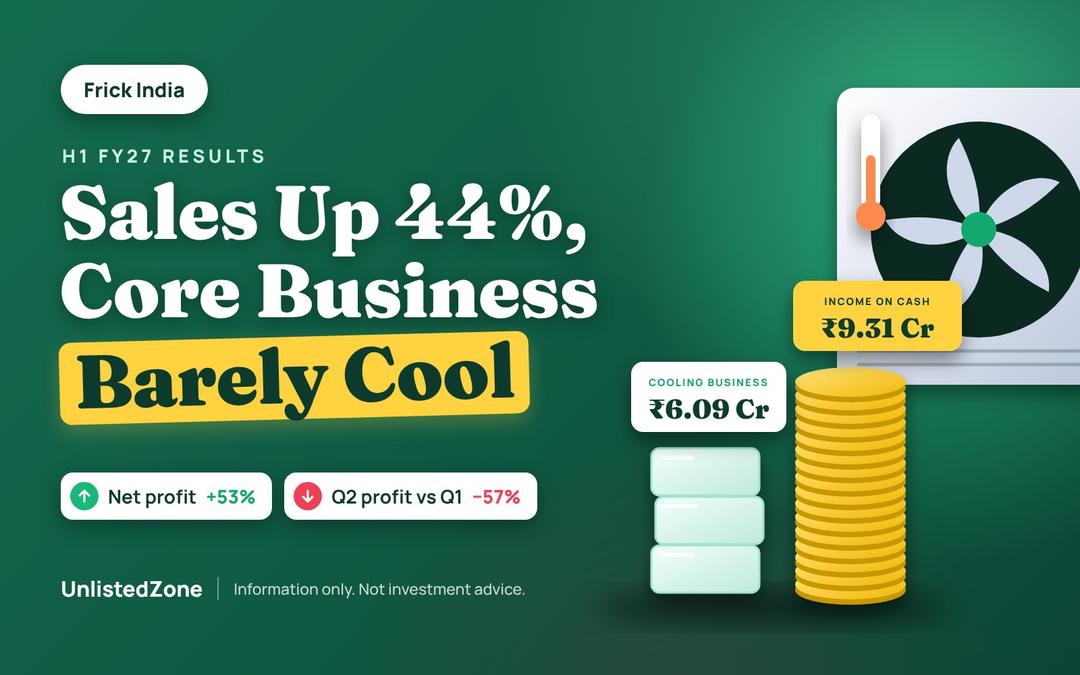
Frick India just posted its best half-year in a while: sales up 44% and profit up 53%. But underneath that, the cooling business itself keeps less than ₹4 of every ₹100 it sells, and two-thirds of profit came from interest on its cash pile.
Think about the last time you had a cold glass of milk, a scoop of ice cream or a chilled beer. Before any of it reached you, it sat in a giant cold room somewhere: at a dairy, a cold storage, or a brewery. Somebody had to build the machines that keep those rooms freezing, 24x7, for years.
That somebody is often Frick India. It's a Faridabad-based engineering company, incorporated back in 1962, and it's one of the quieter names in India's cold chain. On 13 November 2026, it reported results for April–September 2026 (H1 FY27). So let's unpack what happened.
Frick doesn't make the AC in your bedroom. It builds industrial cooling plants: the heavy machinery that keeps an entire warehouse at minus 20°C. Its filing describes the business in one line: manufacture, supply and execution of industrial refrigeration and air-conditioning systems. That's its only business segment.
In plain terms, it makes money in three ways:
How it earns | What that looks like |
|---|---|
| Makes the machines | Compressors, chillers, condensers built at its Faridabad plant |
| Builds the whole plant | Designs the cooling system, supplies the kit and installs it at the customer's site |
| Keeps it running | Spares and servicing over the life of the plant |
The customers are typically dairies, food processors, cold storages, breweries and pharma companies. Frick also owns a stake in Mycom-FIL India, a joint venture with a Japanese refrigeration company. Remember that JV, because it comes back later in the story.
The catch with this kind of business? Projects are big and lumpy, materials are expensive, and customers pay in stages. Keep that in mind as we read the numbers.
At first glance, this is a blockbuster half-year. Here's the scorecard (consolidated, ₹ crore):
Item | H1 FY27 (Apr–Sep 2026) | H1 FY26 (Apr–Sep 2025) | Change |
|---|---|---|---|
| Revenue from operations | 251.92 | 175.24 | +43.8% |
| Other income | 9.31 | 6.42 | +44.9% |
| Total expenses | 245.83 | 172.09 | +42.8% |
| Profit before tax | 14.49 | 9.48 | +52.8% |
| Net profit (PAT) | 10.42 | 6.80 | +53.2% |
| EPS (₹ per share) | 17.37 | 11.34 | +53.2% |
Sales jumped by about ₹77 crore in a single year. Profit grew even faster than sales. And salaries barely moved: employee costs rose just 5%, from ₹32.3 crore to ₹33.9 crore, while revenue grew 44%. So the same team handled a lot more work.
That's the bit that makes the headlines. Now for the plot twists.
Selling more is great. But how much of each sale does Frick actually keep? Not a lot.
Out of every ₹100 of sales | H1 FY27 | H1 FY26 |
|---|---|---|
| Spent on raw materials | ₹73.8 | ₹68.1 |
| Spent on employees | ₹13.5 | ₹18.4 |
| Operating profit (EBITDA, before other income) | ₹3.8 | ₹3.7 |
| Net profit | ₹4.1 | ₹3.9 |
Raw materials are the big villain here. Material costs grew 56%, faster than the 44% growth in sales. That could mean steel and components got costlier, or Frick took on bigger orders at sharper prices to win them. The filing doesn't say which.
The good news is that savings on salaries cancelled most of it out. So operating margin stayed roughly flat at under 4%. Put simply, Frick runs a high-volume, low-margin business: lots of money flows through, very little stays behind.
This is the most interesting part of the story. Frick sits on a big pile of cash and investments: about ₹93 crore in bank balances and FDs, plus about ₹69 crore in long-term investments. That pile earns interest, dividends and gains, which show up as "other income."
Now, here's how H1 profit splits up:
Where pre-tax profit came from (H1 FY27) | ₹ crore | Share |
|---|---|---|
| Core cooling business (operating profit after interest and depreciation) | 6.09 | 42% |
| Other income (interest, dividends, investment gains) | 9.31 | 64% |
| Loss from the joint venture | (0.92) | −6% |
| Profit before tax | 14.49 | 100% |
Yes, you read that right. Nearly two-thirds of pre-tax profit came from the money Frick has parked, not from building cooling plants. Last year it was about the same, at 68%.
That isn't a crime. A cash-rich balance sheet is a cushion in a lumpy project business. But it does mean the core engine is smaller than the headline profit suggests. If interest rates fall or the cash gets used up, profit would feel it.
The six-month total hides a split story. Q1 was excellent. Q2, not so much.
₹ crore | Q1 FY27 (Apr–Jun 2026) | Q2 FY27 (Jul–Sep 2026) | Q2 FY26 (Jul–Sep 2025) |
|---|---|---|---|
| Revenue from operations | 120.77 | 131.14 | 100.04 |
| Other income | 6.07 | 3.24 | 2.14 |
| Other expenses | 9.72 | 12.90 | 9.15 |
| Share of JV loss | (0.30) | (0.62) | (0.09) |
| Profit before tax | 9.78 | 4.70 | 6.21 |
| Net profit | 7.29 | 3.13 | 4.29 |
Sales kept climbing in Q2, up 9% over Q1 and 31% over last year. Yet net profit fell 57% from Q1, and was 27% lower than the same quarter last year.
Three things went wrong at once. Other income nearly halved. Other expenses (freight, site costs, admin and the like) jumped by about ₹3 crore. And the JV's losses doubled. So more sales, but less profit.
Profit is an opinion, cash is a fact. So let's look at what changed between 31 March and 30 September 2026.
₹ crore | 30 Sep 2026 | 31 Mar 2026 | Change | What it tells us |
|---|---|---|---|---|
| Trade receivables | 129.15 | 85.25 | +51% | Customers owe a lot more money |
| Other current liabilities | 84.62 | 46.63 | +81% | Likely customer advances, a sign of new orders |
| Loans given | 25.26 | 0.37 | +₹24.9 cr | A ₹25 cr loan to the JV |
| Total borrowings | 39.40 | 24.79 | +59% | More short-term debt |
| Bank balances and FDs | 93.19 | 91.38 | Flat | The cash cushion is intact |
| Net worth | 337.43 | 327.17 | +3% | Grew by the half's profit |
There's good news and bad news here.
The good news: "other current liabilities" nearly doubled. In project businesses, this line usually holds advances from customers who've placed new orders. If that's what it is here, the order book looks healthy. (The filing doesn't break it down, so treat this as a reasonable read, not a confirmed fact.) Cash from operations also turned positive at ₹8.7 crore, compared with a ₹5.7 crore outflow last year.
The bad news: money owed by customers rose 51% in six months, faster than sales. That's normal-ish for a project company that bills in stages, but it's worth watching. And then there's the JV loan. The cash flow statement shows Frick lent ₹25 crore to Mycom-FIL, its joint venture, which lost ₹0.92 crore this half. To help fund all this, short-term borrowings rose by ₹14.7 crore.
So, Frick is lending money to a loss-making JV while borrowing short-term itself. Investors would want management to explain why.
Frick India had a strong half on the surface, but the core business is still running cool, not hot. Here's the scorecard:
Working well | Worth watching |
|---|---|
| Sales up 44%, profit up 53% | Operating margin under 4% |
| Salary costs barely moved | Two-thirds of profit comes from treasury income |
| Operating cash flow turned positive | Q2 profit fell 57% from Q1 |
| Rising customer advances hint at a fuller order book | ₹25 cr lent to a loss-making JV |
| Low debt next to a ₹337 cr net worth | Receivables rising faster than sales |
India's cold chain is growing, and Frick sits right in its path. The demand side looks fine. The real question is whether Frick can turn all that extra business into fatter margins, rather than relying on its cash pile to make profits look good.
What to track in the next results:
Does operating margin move above 4%, or do material costs keep eating into it?
Do receivables come down as projects get completed and paid for?
What's the plan for the JV, and when does the ₹25 cr loan come back?
Was Q2 a blip, or the start of a slowdown?
Until next time!
Source: Frick India Limited, unaudited standalone and consolidated financial results for the quarter and six months ended 30 September 2026, with limited review by Lodha & Co LLP, dated 13 November 2026. All figures are consolidated. This article is for information only and is not investment advice.