Merino Industries Limited Unlisted Shares
₹ 3300 0.00 (0.00) 1 M
About Merino Industries Limited Unlisted Shares
(A) Background of the Company:
The Merino Group was commissioned in 1965 by the late Man Kumar Lohia and his brothers. The Group has since evolved into the largest manufacturer and exporter of laminates in India. The Company is presently managed by a team of multi-genre professionals. With more than half a decade of experience, the Company has established its respect and leadership in the country’s laminates segment. The Company is headquartered in Kolkata with manufacturing units in Hapur (Uttar Pradesh), Rohad (Haryana), Hosur (Tamil Nadu) and Dahej (Gujarat). The Company has a presence in almost all the States and markets its products in more than 60 countries. The Company’s network of more than 4000 dealers (doubled in the last five years) helps provide products across more than 2000 outlets.
(B) Business Segments:
(i) Interior Solutions: Merino is a versatile manufacturer and marketer of Interiors Solutions with a wide array of products for homes, offices, commercial and public areas. In Interior Solutions, plywood was their first product in 1974. 
(ii) In the Agro Business:
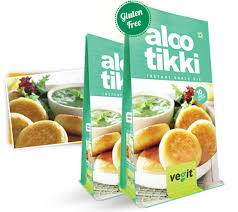
The Merino Group initially began in the cold storage business and subsequently diversified into farming, biotechnology, and food processing. The integration in both directions - forward and backward - has shaped the brand initiative in the FMCG market where we have launched potato flakes and ready to eat snack mixes under a very popular brand name 'Vegit'.

(iii) In Information Technology Services:
Merino Services Limited is a Business Consulting and IT Services organization providing value-added services as a Partner-in-Progress with the esteemed customers and business associates. They specialize in the design/implementation of various business solutions for our customers. Note: 90% of the business comes from Laminates and rest from others.
(c) Corporate Video to understand Merino Industries
Fundamentals
Per Equity Share
Merino Industries Limited Unlisted Shares
₹3300
Merino Industries Limited Unlisted Shares
*Best In Industry
Create Alert


Financials (Figures in cr)
Frequently Asked Questions
Find answers to common questions that you may have in your mind.
Please find below the procedure for buying Merino Industries Limited Unlisted Shares at UnlistedZone.
- 1. You confirm booking of Merino Industries Limited Unlisted Shares Unlisted Shares with us at a trading price.
2. You provide your client master report (ask the broker if not available) along with PAN Card and Cancelled Cheque in case you are not transferring funds from the bank account as mentioned in the CMR Copy. These are KYC documents required as per SEBI regulations.- 3. We Will Provide the Bank details. You need to transfer funds to that account.
- 4. Payment has to be done in RTGS/NEFT/IMPS CHEQUE TRANSFER. No CASH DEPOSIT.
5. Payment has to be done from the same account in which shares are to be credited.- We will transfer the shares in 24 hours if funds are credited before 2 pm. Important
Note: Please note that the lock-in period for selling Merino Industries Limited Unlisted Shares Unlisted Shares is 6 months after listing. Hence, you can’t sell Merino Industries Limited Unlisted Shares Unlisted Shares which you bought in Pre-IPO for 6 months after its listing. i.e., You can sell it only after 6 months calculated from the listing date. For any queries, please contact us at sales@unlistedzone.com
Please find below the procedure for selling Merino Industries Limited Unlisted Shares at UnlistedZone.
1. We will confirm our buying price of Merino Industries Limited Unlisted Shares.
2. We will give you our client master report and you will transfer Merino Industries Limited Unlisted Shares to our demat account.
3. We will ask for your bank details once Merino Industries Limited Unlisted Shares are received in our demat account.
4. We will transfer the funds to your bank account within 24 hrs of receiving Merino Industries Limited Unlisted Shares.
5. Payment will be made in RTGS / NEFT / CHEQUE TRANSFER/IMPS. No CASH DEPOSIT.
6. Payment will be given in the same account which is linked to the demat account or you need to provide the cancelled cheque showing your name to verify. As per SEBI regulations, the transfer of funds to a third-party account is not legal and our policy refrains us from doing so.
Note: The price at which we are buying is fixed for 3 days. If you can't sell your stock within 3 days, then the price of that day will be applicable when we receive the shares in our demat.
The lock-in period for Merino Industries Limited Unlisted Shares varies depending on the category of investors:
- 1. For Venture Capital Funds or Foreign Venture Capital Investors, there is a lock-in period of 6 months from the date of acquisition of Merino Industries Limited Unlisted Shares.
2. For AIF-II (Alternative Investment Funds - Category II), there is no lock-in period.
3. For other types of investors, which include Retail Investors, High Net-worth Individuals (HNIs), or Body Corporates, the lock-in period is 6 months from the date of the IPO listing of Merino Industries Limited Unlisted Shares.
This regulation was introduced by SEBI in August 2021. The rule change, which reduced the lock-in period from one year to six months, was aimed at encouraging more investments in startups that are preparing for public offerings or IPOs. This reduction in the lock-in period is seen as a significant step forward, and since its introduction, many Portfolio Management Services (PMS) have been advising their clients to invest in Pre-IPO shares to capitalize on the benefits of early-stage investments.
DIS, or Delivery Instruction Slip, is a tool used by investors to sell or transfer Merino Industries Limited Unlisted Shares from their demat account to another. There are two types of DIS Methods:
1. Offline-DIS: This is a traditional, paper-based method for transferring shares. When using Offline-DIS, investors are required to fill out a DIS form and submit it to their broker. The necessary fields in the form include:
a. ISIN number of Merino Industries Limited Unlisted Shares.
b. Name of Merino Industries Limited Unlisted Shares.
c. Quantity of Merino Industries Limited Unlisted Shares.
d. Consideration Amount.
e. Target DP ID and Client ID.
f. Annexure.
2. Online DIS: Some brokers offer the facility to transfer Merino Industries Limited Unlisted Shares through an online DIS system. It's advisable to check with your broker if such a facility is available.
For instance, platforms like Angel Broking provide an Online-DIS feature. In this method, an investor simply needs to add a beneficiary and transfer Merino Industries Limited Unlisted Shares by filling in details similar to those required in the Offline-DIS.
For a more comprehensive understanding of this process, you can refer to our detailed article: https://unlistedzone.com/how-do-i-sell-my-unlisted-shares/
In recent years, the unlisted share market has expanded significantly, leading to a reduction in the minimum investment amount. Previously, the typical investment ticket size ranged from 5-10 Lakhs, but in the current market scenario, it has decreased to between 35-50k. Therefore, through our UnlistedZone platform, if someone wishes to invest in Merino Industries Limited Unlisted Shares, the minimum investment required would now be in the range of 35-50k
Yes, buying and selling unlisted shares in India is indeed 100% legal. This activity is regulated and governed under the guidelines provided by the Securities and Exchange Board of India (SEBI). Investors and traders must adhere to these regulations and guidelines to ensure compliance with legal and financial standards. It's important for participants in the unlisted share market to be aware of and understand these regulations to engage in transactions legally and securely
When you sell unlisted shares within a period of two years from the date of acquisition, any profit earned from the sale is classified as Short-term Capital Gain (STCG). This gain is then added to your total income for that financial year. The tax on this short-term capital gain is calculated based on your applicable individual income tax slab rates. Therefore, the rate at which you will pay tax on the STCG from unlisted shares depends on your total income, including this gain, and the tax slab it falls under as per the prevailing income tax laws in India. It's important for investors to consider these tax implications when engaging in transactions involving unlisted shares.
Long-term Capital Gains (LTCG) on unlisted shares in India refer to the profits earned from the sale of unlisted shares that have been held for more than two years. The key aspects of LTCG on unlisted shares include:
- 1. Tax Rate: LTCG on unlisted shares is taxed at a rate of 20%.
2. Indexation Benefit: This is a significant advantage for investors. Indexation allows for adjusting the purchase price of the shares for inflation, which can reduce the taxable gain.
3. Importance for Investors: Understanding LTCG is crucial, especially for High Net-worth Individuals (HNIs) and retail investors, as it impacts their investment strategy and tax planning. Knowing these details helps in making informed investment decisions.
4. Calculation: LTCG is calculated by subtracting the indexed cost of acquisition (the purchase price adjusted for inflation) from the sale price of the shares. The profit thus calculated is subject to a 20% tax.
5. Applicability: LTCG tax is applicable to profits from the sale of unlisted shares held for more than two years.
6. Relevance: This tax is particularly relevant to investors in the unlisted share market, including those considering selling their holdings after a period of more than two years.
When shares initially bought in the unlisted market become listed, the taxation rules change significantly if these shares are sold through a stock exchange. Here's what investors need to know:
Transition to Listed Market Tax Rates:
Once unlisted shares are listed on the stock exchange and subsequently sold, the tax rates applicable to listed securities come into effect. This shift means that the favorable tax treatments for listed shares, as per the prevailing tax laws, will apply.
Taxation Based on Holding Period:
The crucial factor in determining the type of capital gains tax (Long-term or Short-term) is the holding period of the shares. Importantly, this period is calculated from the original purchase date when the shares were unlisted.
Long-term vs. Short-term Capital Gains: If the shares are sold after being held for more than one year from the date of purchase (including the period when they were unlisted), they are subject to Long-term Capital Gains (LTCG) tax.
Conversely, if sold within one year, Short-term Capital Gains (STCG) tax rates apply.
Significance for Investors: This information is vital for investors in the unlisted market, as it impacts their tax planning and decision-making process. Understanding these nuances ensures that investors can strategically plan the sale of their shares post-listing to optimize tax implications.
Advice for Investors: It's advisable for investors to keep a record of their purchase dates and monitor the listing dates closely. Additionally, staying updated with the latest tax regulations or consulting with a financial advisor is recommended for accurate tax calculations and compliance.
When you purchase Merino Industries Limited Unlisted Shares through UnlistedZone, it's important to note that, as per SEBI regulations, these shares can only be transferred to a demat account.
There are two primary ways to check the credit of Merino Industries Limited Unlisted Shares in your account:
1. Using NSDL or CDSL Applications:
Download the NSDL or CDSL application from the Google Play Store.
To determine whether your stock broker is registered with NSDL or CDSL, you can examine the format of your Demat Account number. The Demat Account number consists of 16 characters, combining the DP ID and Client ID.
DP ID is the unique identification number of the Broker, assigned by CDSL or NSDL.
Client ID is the unique identification number of the Client, representing their portfolio.
In CDSL, the Demat Account number is entirely numeric (e.g., 12345678 for DP ID and 91234567 for Client ID).
In NSDL, the first two characters are alphabetic, representing the country (e.g., 'IN' for India), followed by a 6-digit unique number for the Broker (DP ID) and an 8-digit Client ID (e.g., IN123456 for DP ID and 78912345 for Client ID).
2. Checking in Broker's Application:
The credit of Merino Industries Limited Unlisted Shares can also be checked in your broker's application. However, it's important to note that it may take T+2 days for the shares to show up in the application after the transaction.
The Merino Industries Limited Unlisted Shares are credited in the demat account on the same day as the transfer of funds into our company's bank account.
"The price of Merino Industries Limited Unlisted Shares can be checked in two ways. First, you can join our Telegram channel, where we share the latest prices of all unlisted shares daily in the morning. Secondly, you can check price on our UnlistedZone platform to view historical graphs and prices of all shares in one place."
Investing in Merino Industries Limited Unlisted Shares, like any investment, carries certain risks that should be carefully considered:
1. Liquidity Risk: Unlisted shares, by their nature, are not traded on public stock exchanges. This can result in lower liquidity compared to listed shares, meaning it might be more challenging to find buyers when you wish to sell your shares.
2. Price Volatility: The price of Merino Industries Limited Unlisted Shares can be more volatile compared to listed shares. This is partly due to the lack of regular public trading and potentially limited information available about the company's financial health and performance.
3. Regulatory Risk: Unlisted shares are subject to different regulatory frameworks than listed shares. Any changes in regulations or compliance requirements can impact the value and tradeability of these shares.
4. Limited Information: There may be less publicly available information about unlisted companies. This can make it more difficult to assess the company's true value and potential for growth, increasing the risk of investment.
5. No Guarantee of Future Listing: Investing in Merino Industries Limited Unlisted Shares with the expectation of future listing on a public exchange carries the risk that the listing may not occur. This can affect both the liquidity and potential value appreciation of the shares.
6. Company-Specific Risks: Each company has its own set of risks based on its industry, management, financial health, and market position. These risks can significantly impact the performance of your investment in Merino Industries Limited Unlisted Shares.
UnlistedZone: Pioneering Excellence in India's Unlisted Share Market
UnlistedZone stands as India's fastest-growing and leading marketplace for buying and selling unlisted shares. Over the past 5 years, we have carved a niche in the financial market, website hit user inflows over a 2 million users on our platform since inception. This remarkable journey is underscored by the sheer volume of transactions facilitated through UnlistedZone, which has already surpassed the 300 Crore mark.
At the helm of our success are our esteemed co-founders, Mr. Umesh Paliwal and Dinesh Gupta. Their insights and expertise are regularly sought after by leading financial publications such as MoneyControl, Business Standard, and The Economic Times, particularly for their authoritative views on IPOs and the unlisted market. Our journey over these 5 years has not just been about numbers; it's been about building trust and reliability.
UnlistedZone has established a formidable reputation in the industry, earning the trust and confidence of our users. This trust is our cornerstone, ensuring that new investors can engage with us without the apprehensions of fraud that are often associated with unknown brokers in the market.
At UnlistedZone, we are committed to maintaining the highest standards of transparency and integrity, ensuring that your investment journey is not just profitable but also secure and trustworthy.
Valuation Methodology at UnlistedZone for Merino Industries Limited Unlisted Shares
At UnlistedZone, we employ a meticulous and strategic approach to valuing Merino Industries Limited Unlisted Shares, utilizing two primary methods: Benchmark Valuation Based on Latest Funding:
1. Our first step is to examine the most recent funding round for Merino Industries Limited Unlisted Shares. This provides us with a benchmark valuation, offering a clear indication of the company's current market value as perceived by investors and industry experts. This method is particularly effective in capturing the latest market sentiment and financial health of the company.
2. Comparison with Listed Peers: In cases where there hasn't been recent funding for Merino Industries Limited Unlisted Shares, we adopt a comparative approach. This involves identifying a business in the listed market that closely resembles Merino Industries Limited Unlisted Shares in terms of industry, size, and business model. By comparing and contrasting the two, we can ascertain a fair valuation for Merino Industries Limited Unlisted Shares, drawing on the market data and performance metrics of its listed counterpart.
Investor Advisory: As experts in the unlisted space, we at UnlistedZone emphasize the importance of thorough risk assessment to all our investors. It's crucial to evaluate all risk parameters carefully before investing in unlisted shares. This due diligence is key to making informed and strategic investment decisions in the dynamic and evolving unlisted market.
"At UnlistedZone, our approach to sourcing Merino Industries Limited Unlisted Shares involves a strategic and direct method. Primarily, we acquire these shares from two key groups:
1. Employees of the Company: Often, employees of a company receive shares as part of their compensation or through employee stock option plans (ESOPs). Over time, some of these employees may decide to liquidate their holdings for various reasons, such as financial needs or portfolio diversification. We engage with these employees, providing them a platform to sell their shares.
2. Initial Investors: These are the early-stage investors or angel investors who provided capital to the company during its initial phases. As the company grows and evolves, these initial investors might look to sell part or all of their stake in the company. This could be for reasons like capitalizing on their investment, reallocating assets, or other strategic financial decisions.
By connecting with these groups, UnlistedZone ensures a reliable and consistent supply of Merino Industries Limited Unlisted Shares for our clients. This method not only helps employees and initial investors in liquidating their assets but also provides our clients with access to shares that are not readily available in the public market. It's a win-win for both the sellers and buyers, facilitated efficiently through our platform."
"The Securities and Exchange Board of India (SEBI) does have a regulatory influence on the unlisted market, though it's not as comprehensive as its oversight of the listed markets.
Key aspects of SEBI's involvement in the unlisted space include:
1. Applicable Rules and Regulations: Certain SEBI regulations are indeed applicable to transactions in the unlisted market. This includes the mandatory lock-in period of 6 months, the requirement to pay stamp duty, and depository participant (DP) charges for every transaction. These measures are in place to ensure a certain level of standardization and protection in the unlisted market, similar to those in the listed markets.
2. Lack of Specific Regulation for Unlisted Brokers: As of now, SEBI does not have specific regulations for becoming an unlisted broker. This means that while certain SEBI rules apply to transactions within the unlisted market, the process of becoming a broker in this space is not directly regulated by SEBI. This lack of direct regulation highlights the importance of due diligence by investors when engaging with brokers in the unlisted market.
3. Investor Protection and Transparency: The regulations that do apply, such as the lock-in period and transaction charges, are designed to protect investors and add a layer of transparency to these transactions. They aim to mitigate some of the risks inherent in trading unlisted securities, which typically don't have the same level of public scrutiny and regulatory oversight as listed securities. In summary, while SEBI's regulatory framework does extend to certain aspects of the unlisted market, it does not comprehensively regulate all aspects of it, particularly concerning the accreditation of unlisted brokers. This underscores the need for investors to exercise caution and conduct thorough research when participating in the unlisted market."
"For comprehensive and up-to-date news and information about Merino Industries Limited Unlisted Shares, we have several platforms to keep you informed. Our website is regularly updated with the latest insights and developments. For real-time updates and engaging discussions, you can join our Telegram channel. Additionally, follow us on Twitter for quick news bites and industry trends. And for more in-depth analysis and informative content, subscribe to our YouTube channel. These resources are designed to provide you with a well-rounded understanding of the unlisted market, ensuring you have access to all the information you need about Merino Industries Limited Unlisted Shares."